Can you help me in designing a Conversion Funnel Dashboard in Dashboard Beta?
Best answer by mozart-morales
View originalCan you help me in designing a Conversion Funnel Dashboard in Dashboard Beta?
Best answer by mozart-morales
View originalHi
I will share what i did after our workshop and you can see if that will help you.
Step 1:
Define what you would like to measure: in my case i would like to count distinct cards in each phase, so first my measure will be "Cards Count - Distinct"
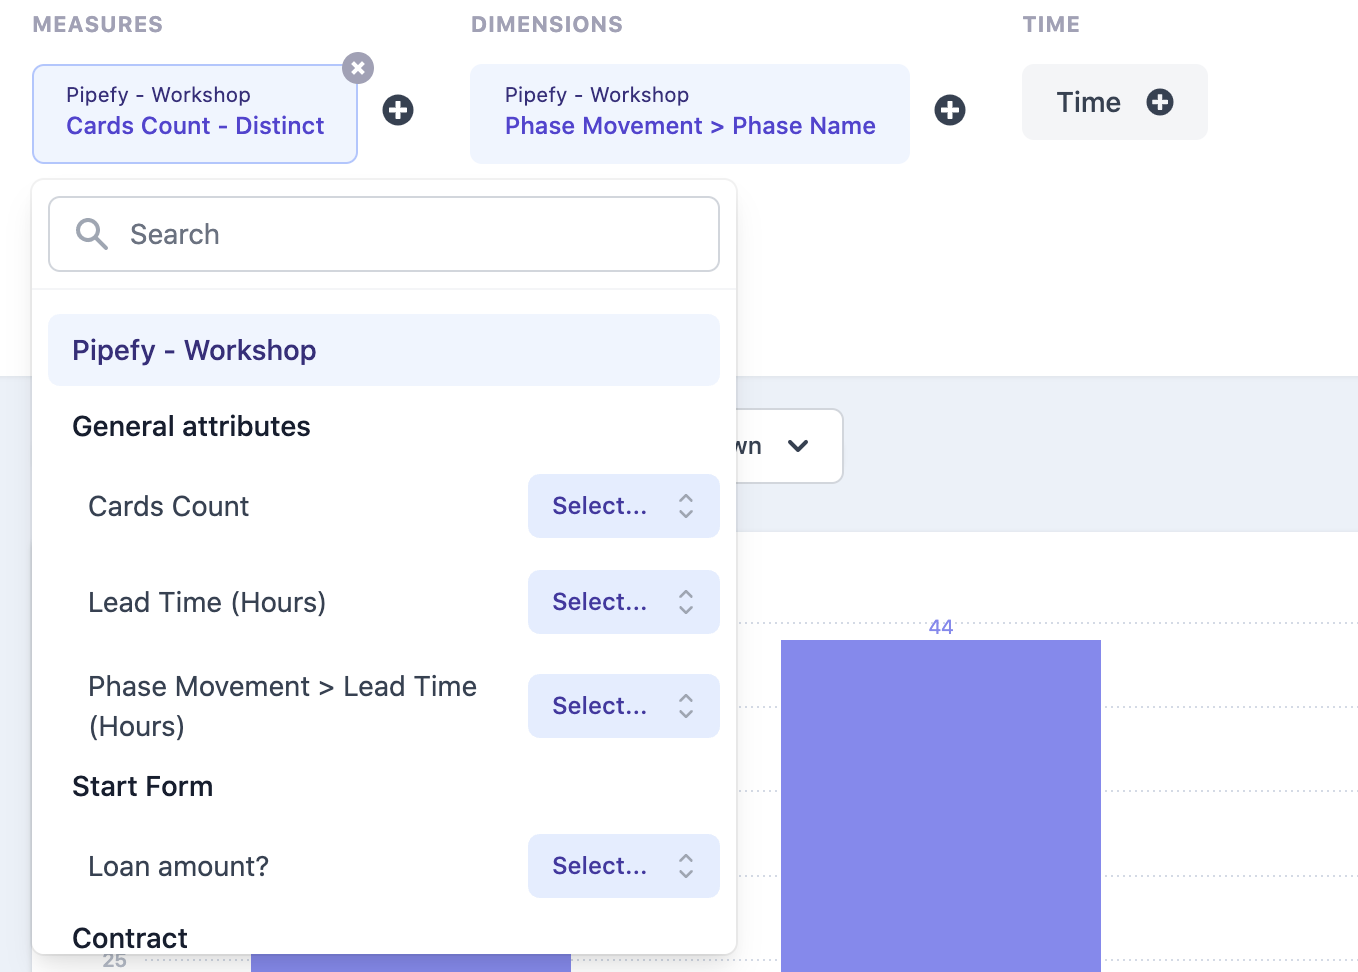
Step 2:
Define dimension: in my case i would like to see cards in each phase movement, so my dimension will be "Phase movement > Phase Name"
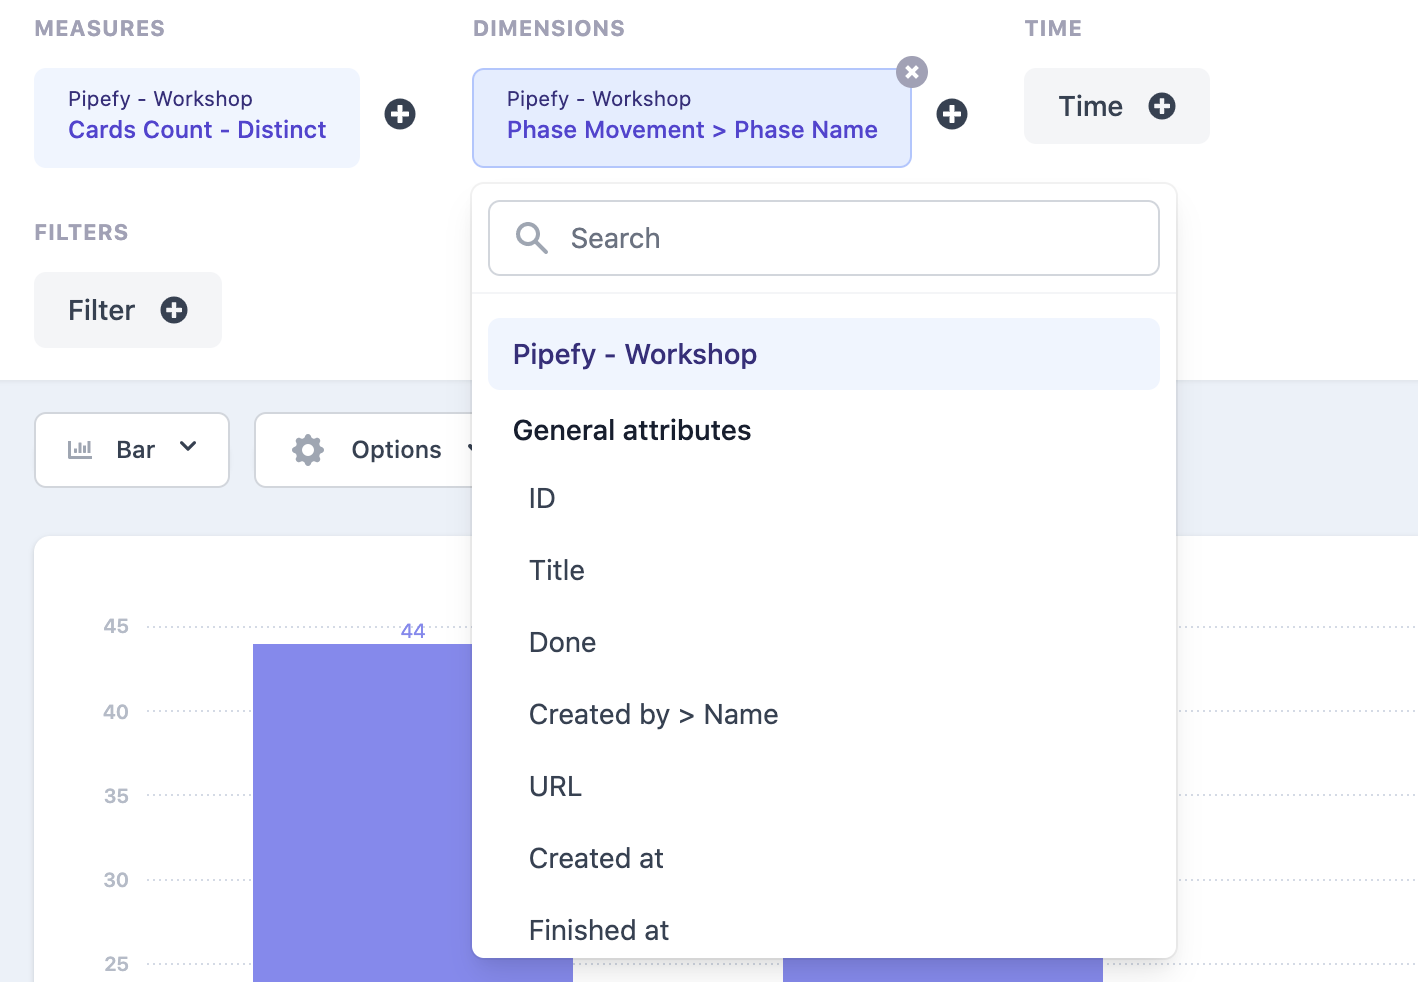
Step 3:
Time, in my case i will not add any specific date but you can add if you want
After that i will be able to see:
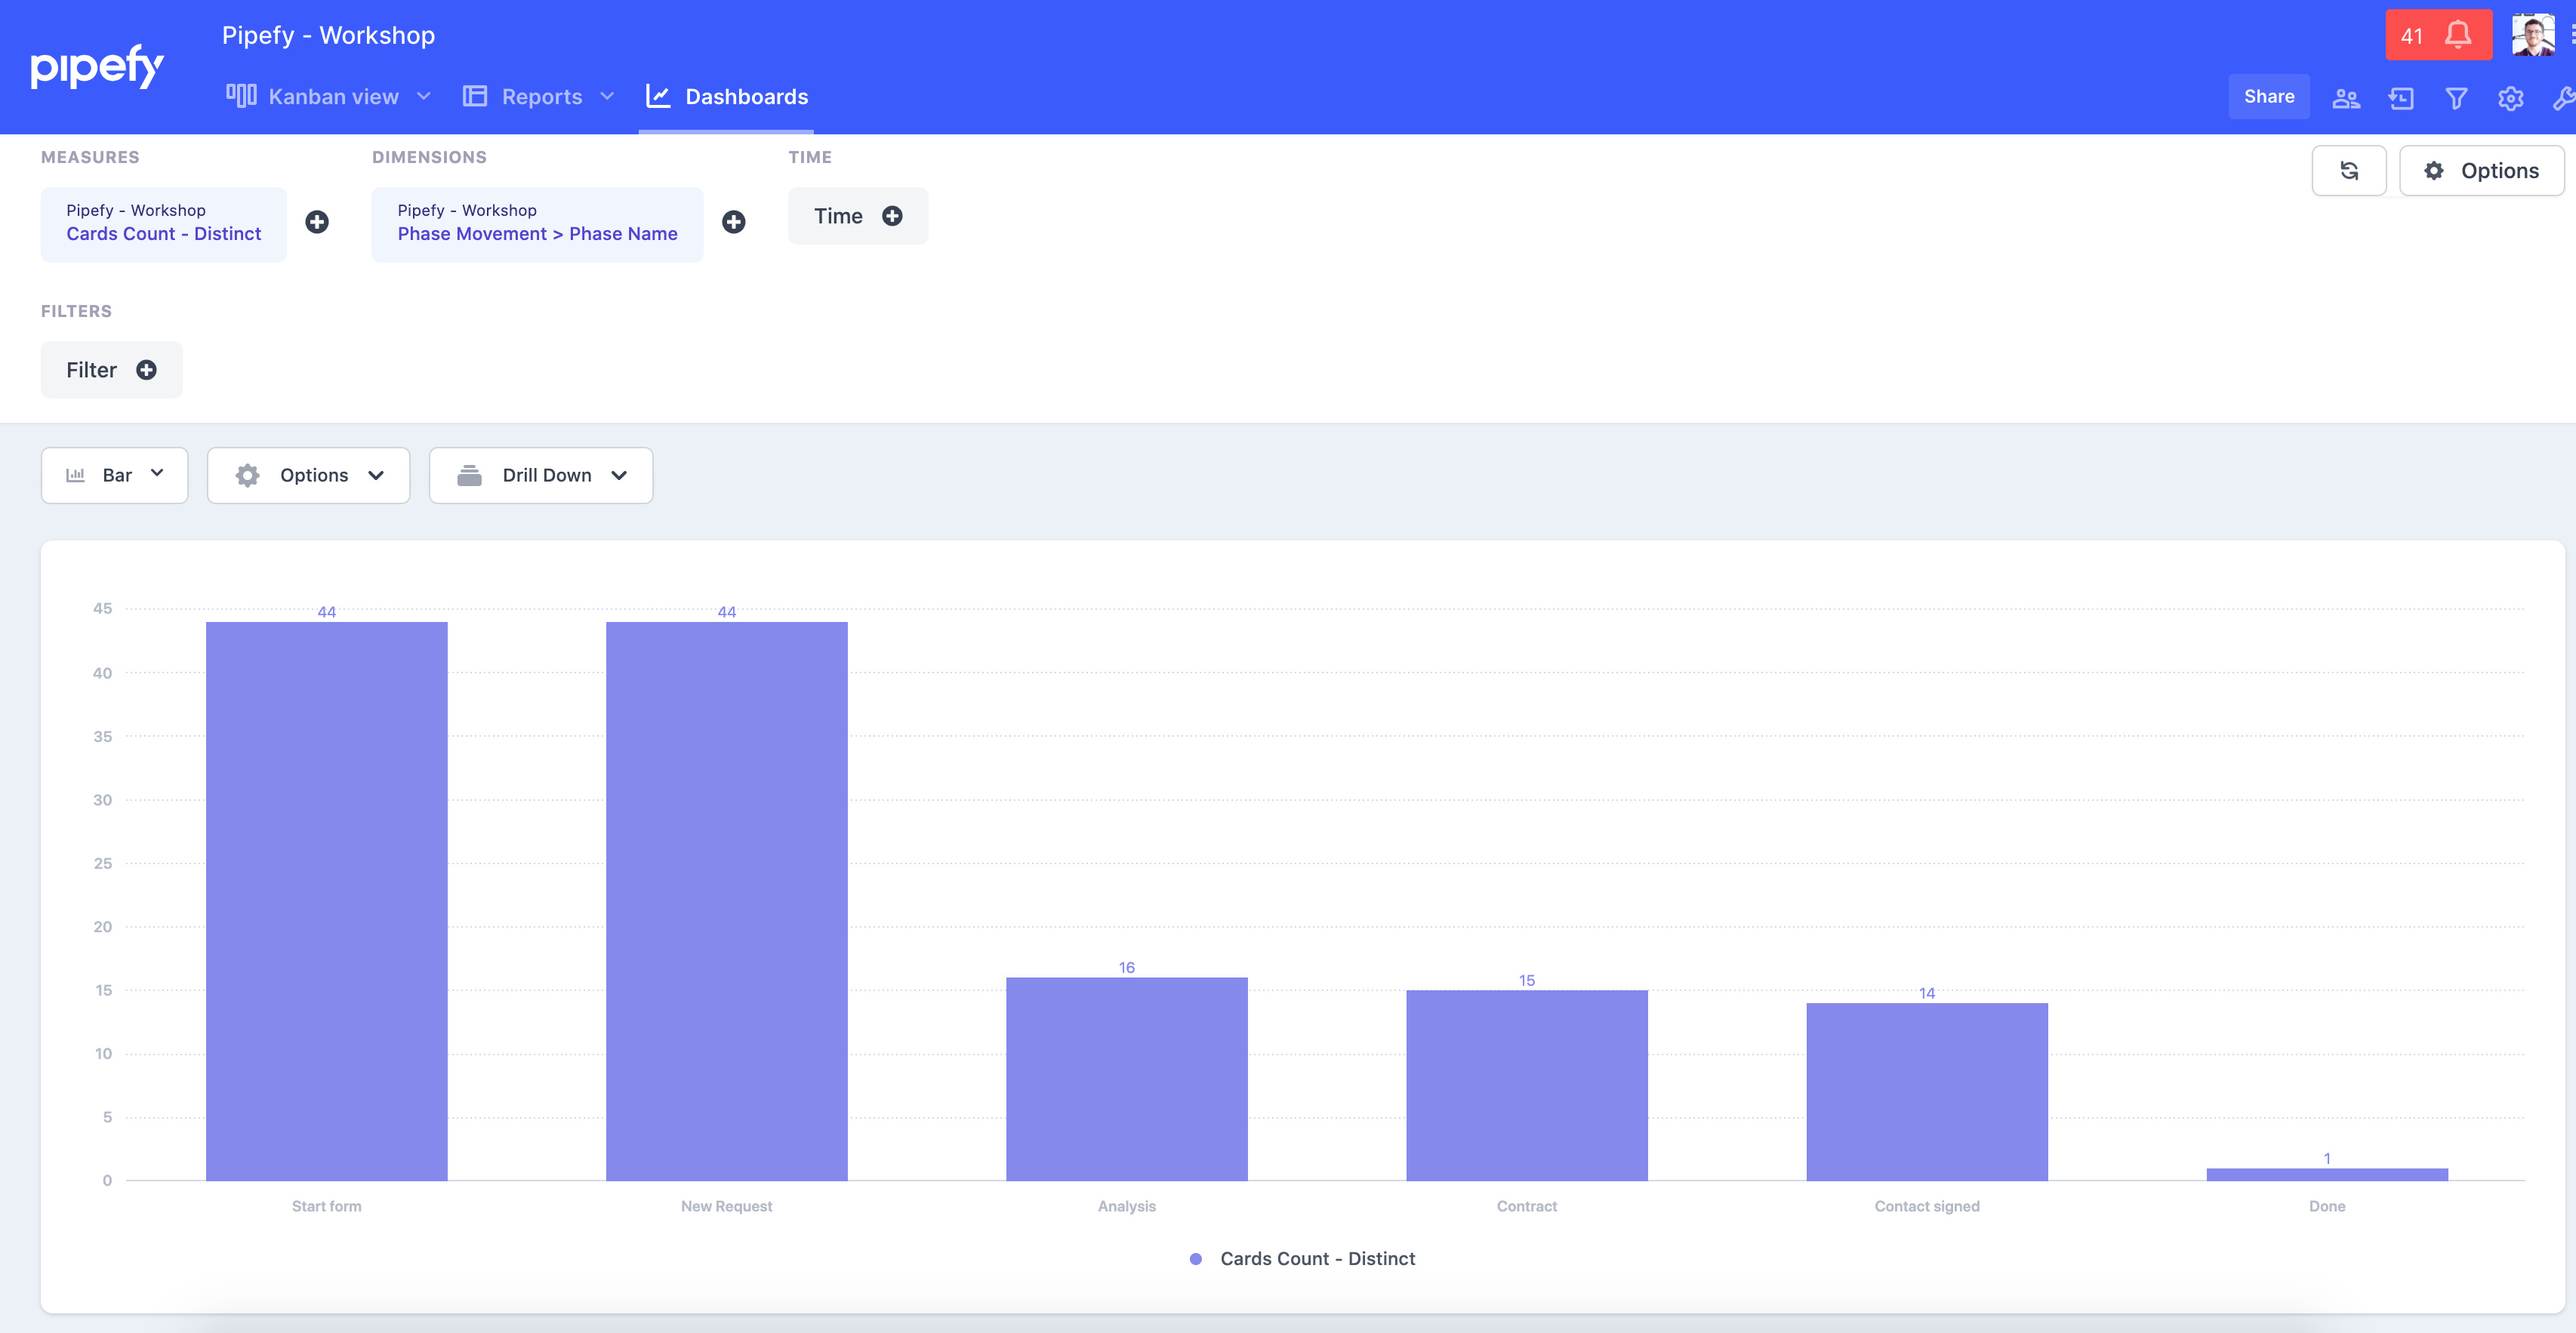
That is my "Conversion Funnel":
how many cards "opportunities" are in each phase:
"New requests"
Analysis
Contract
Contract signed
Done
that helps you?
If no, please let me know and i will try to help you :)
Hi
And i think is it possible to solve too.
My example here:
I would like to send NPS message for my customers and after i would like to see:
a. % of customers (leads) answer (converted) to Promoters (Phase 2)
First:
Build a new dashboard
Measures: Card count DISTINCT"> Dimensions "Phase movement > Phase name"
Second: Filter by phase name that i would like to see the conversion so "Send NPS (portuguese will be Enviar NPS) and Promoter (Promotor)
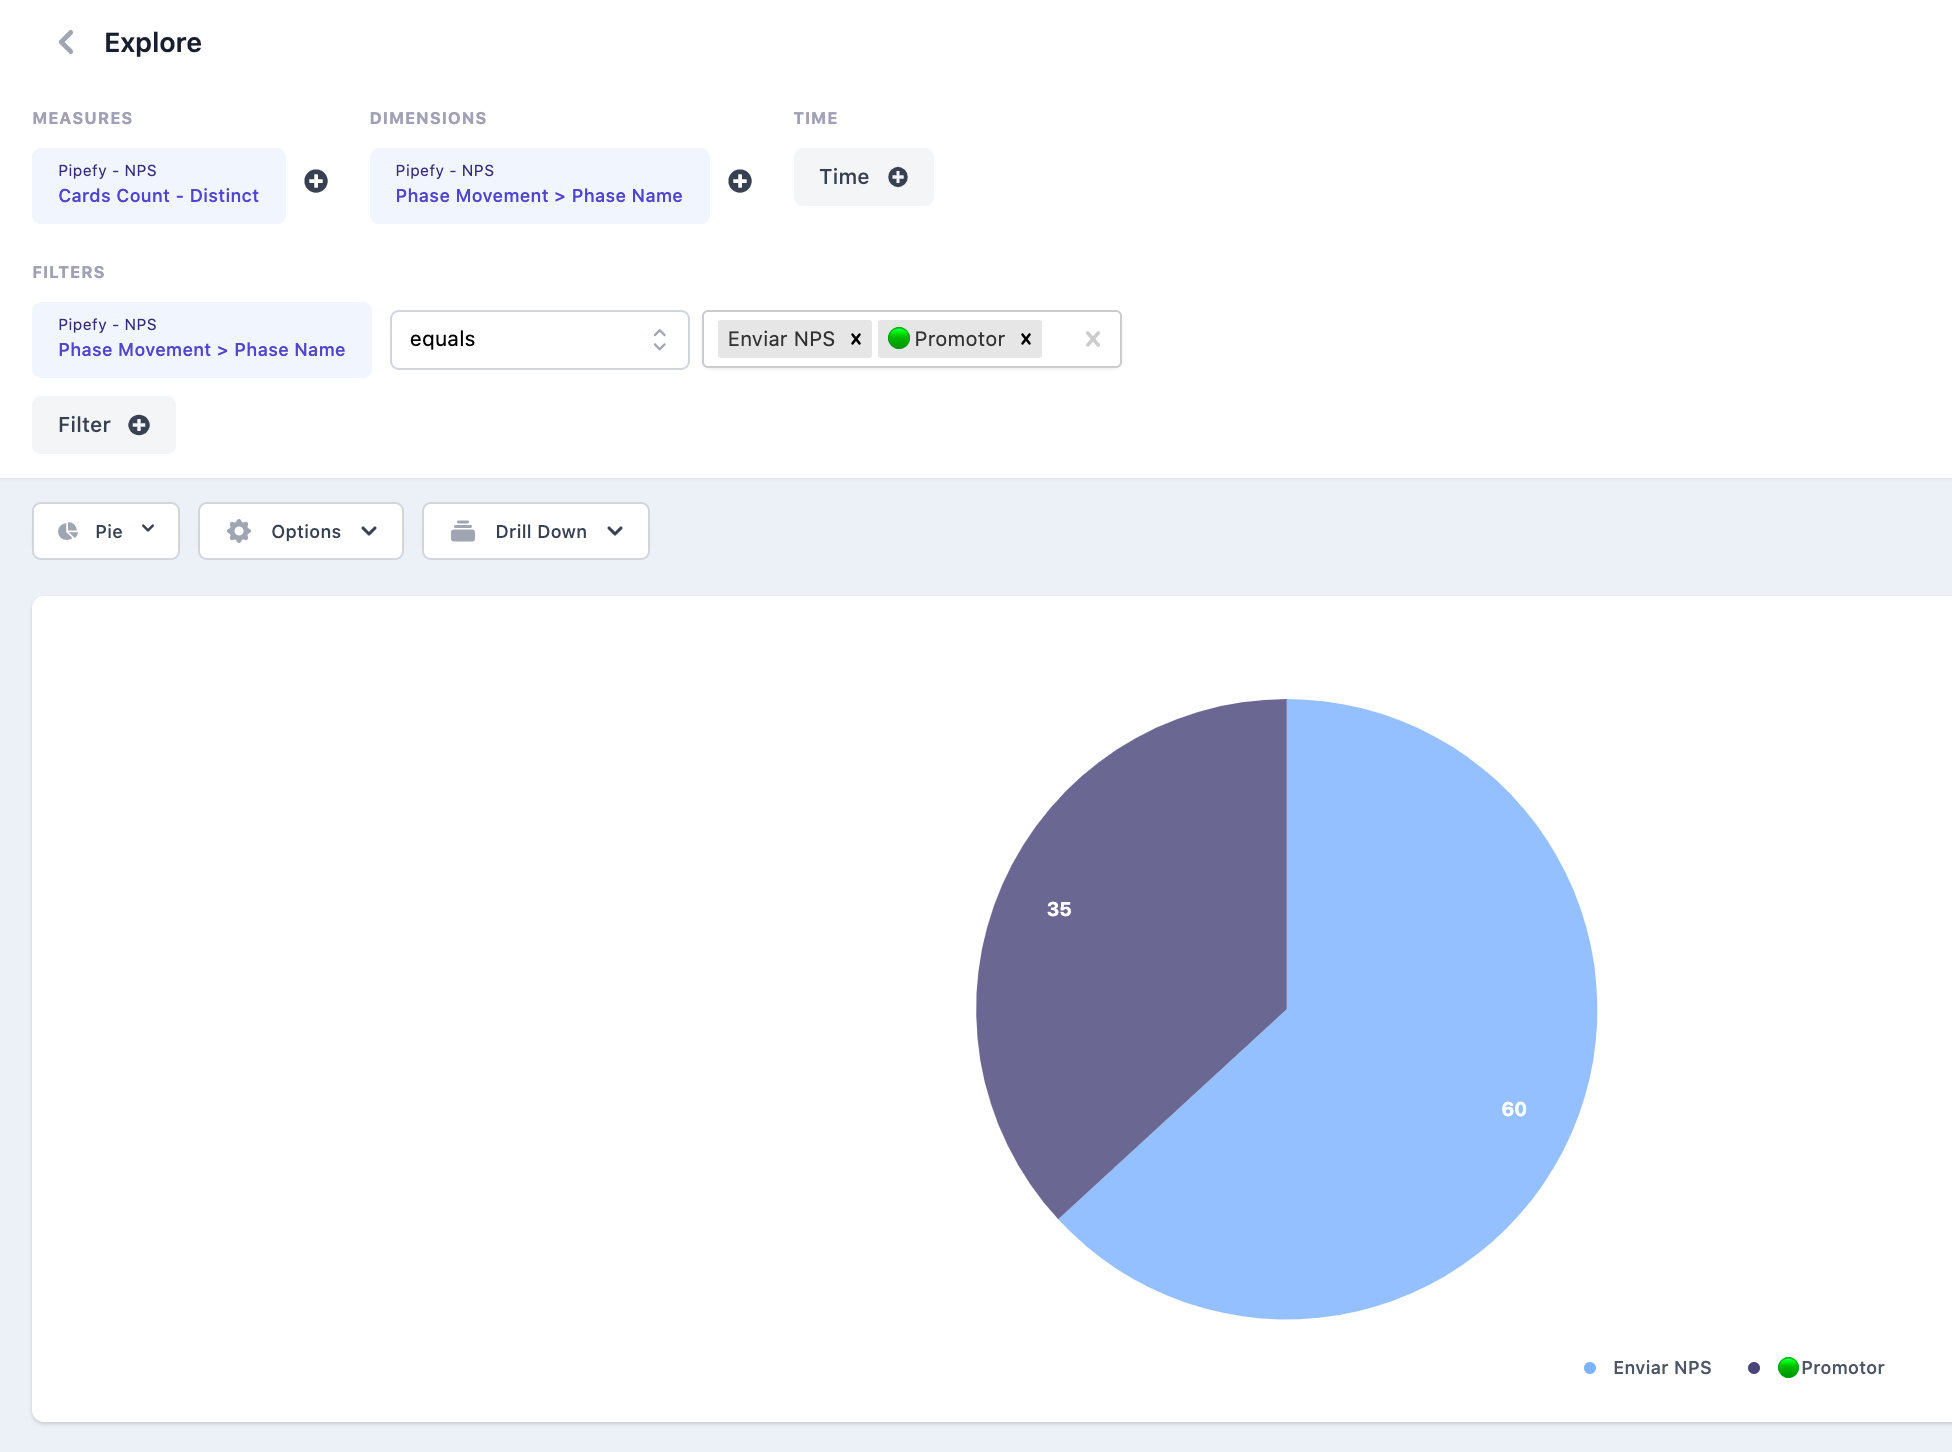
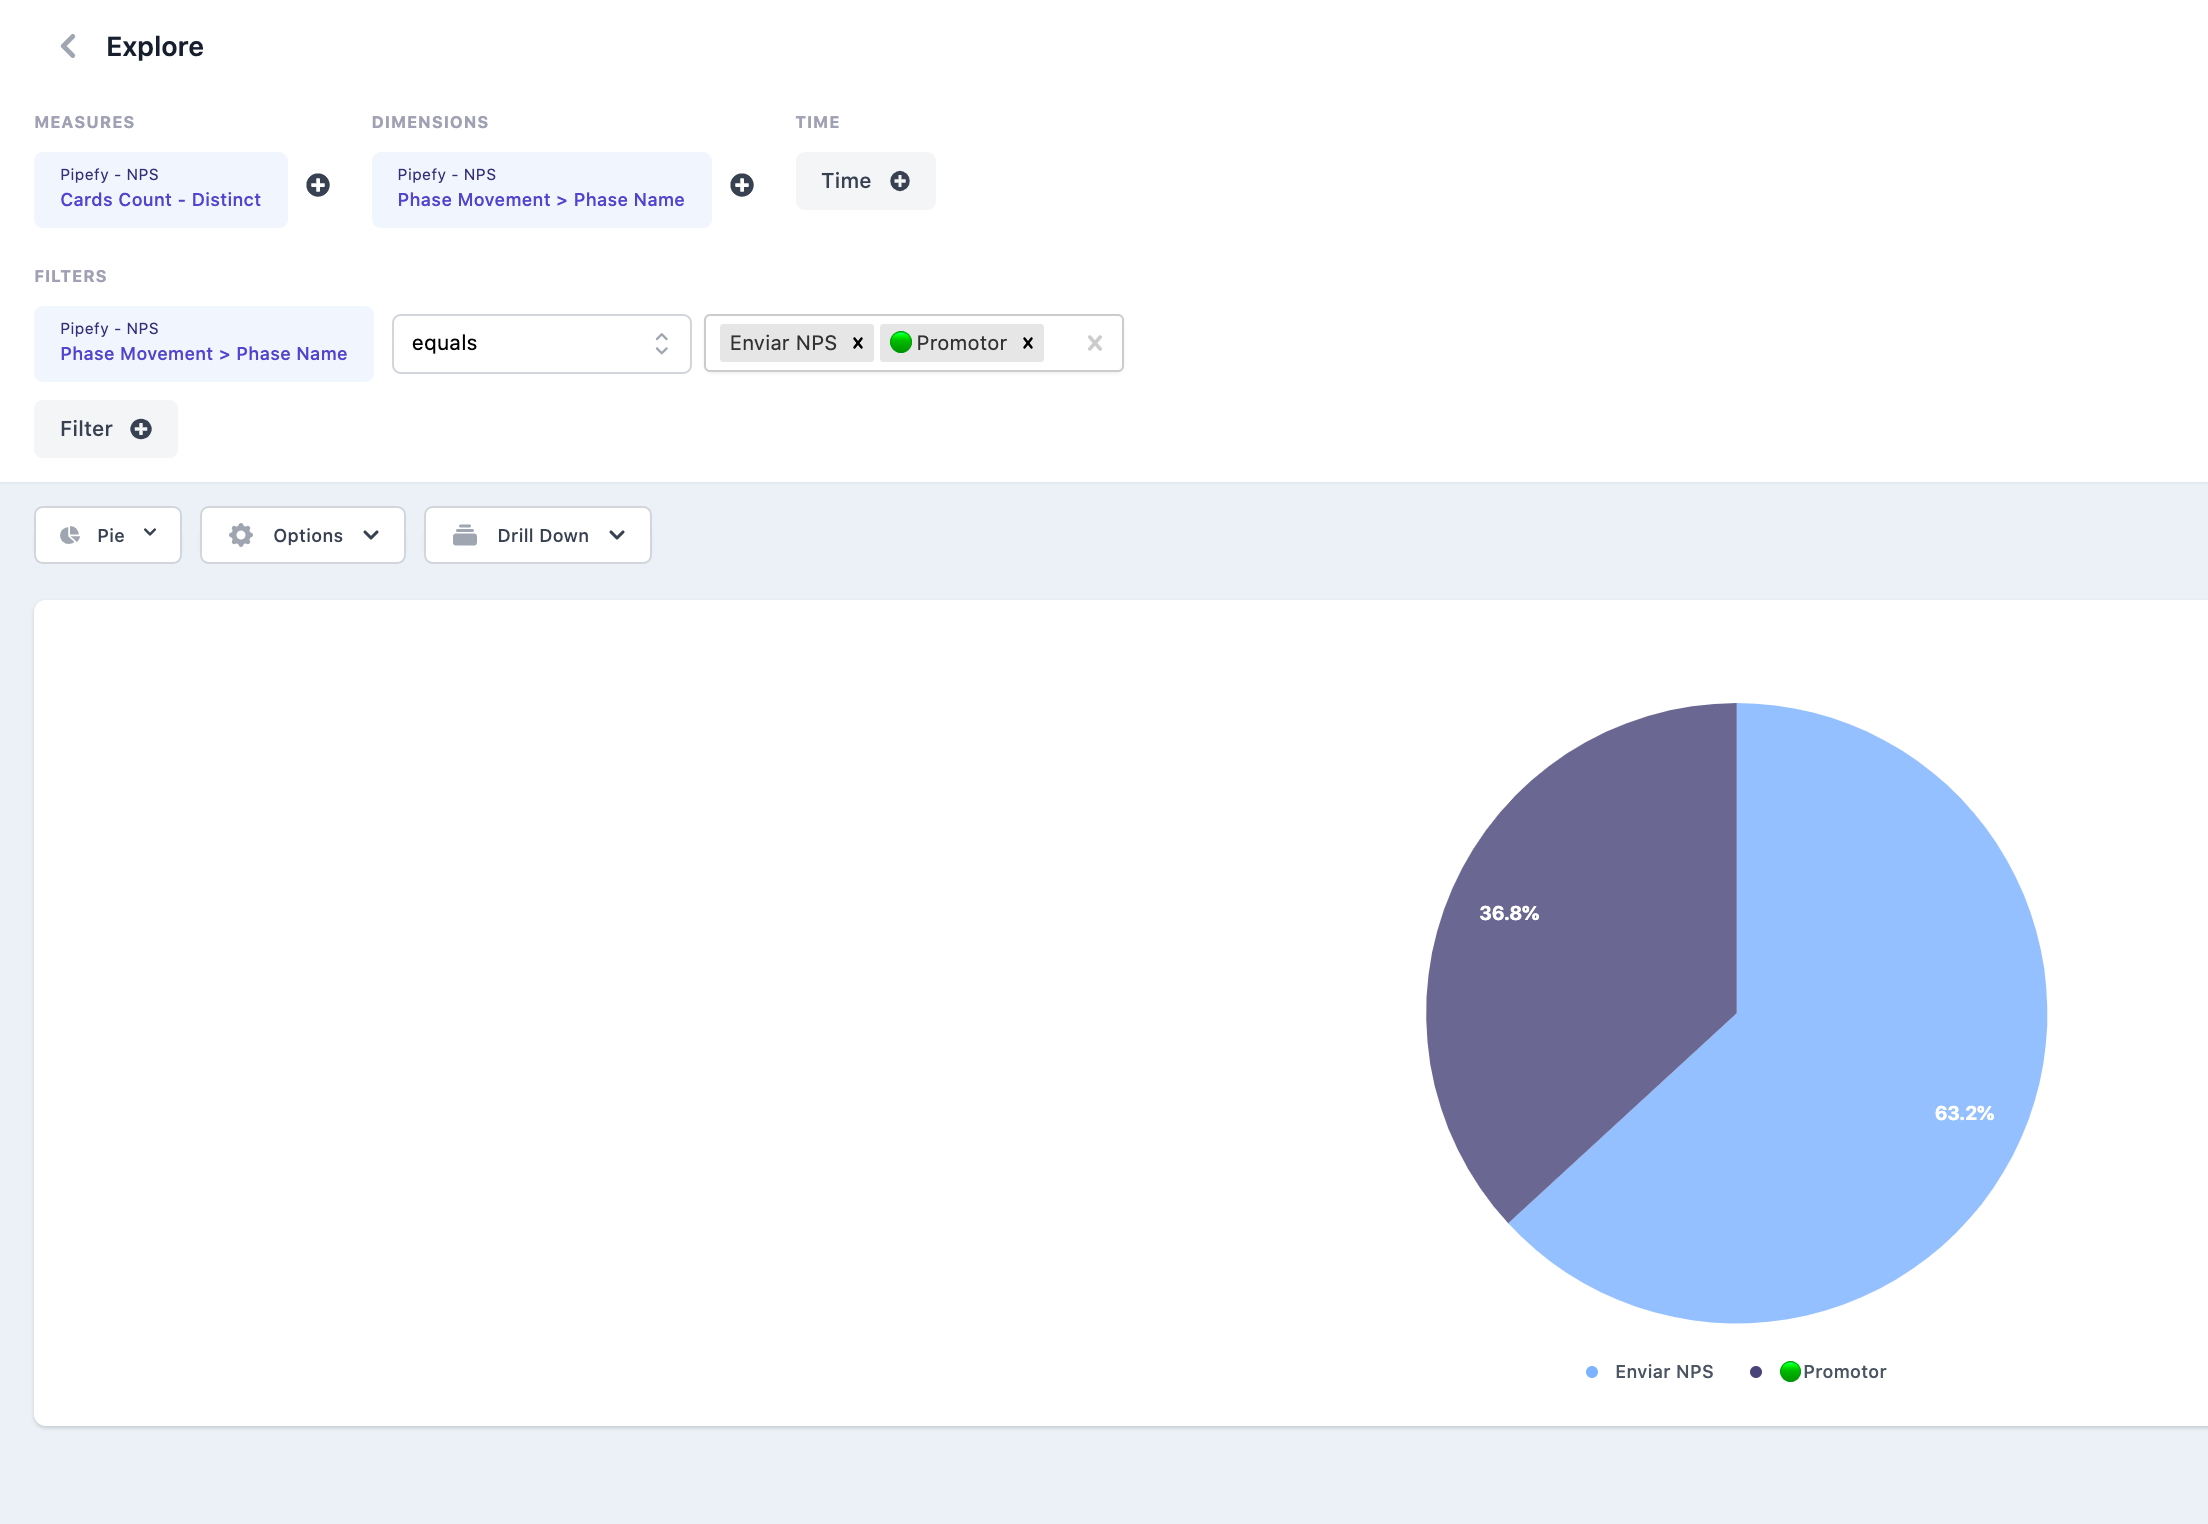
What you can see is that: Total number of card that "passed" to my phase "Send NPS"= 60
Also, total cards that are in "Promoter" right now "35"
So i can see a % of 36.8% of all "leads" that "convert" to Promoter.
And now we need to build more 3 charts with the other values so we will see the a.b.c.d itens.
Do you think that will solve?
Hum, you are right!
Thanks for that!
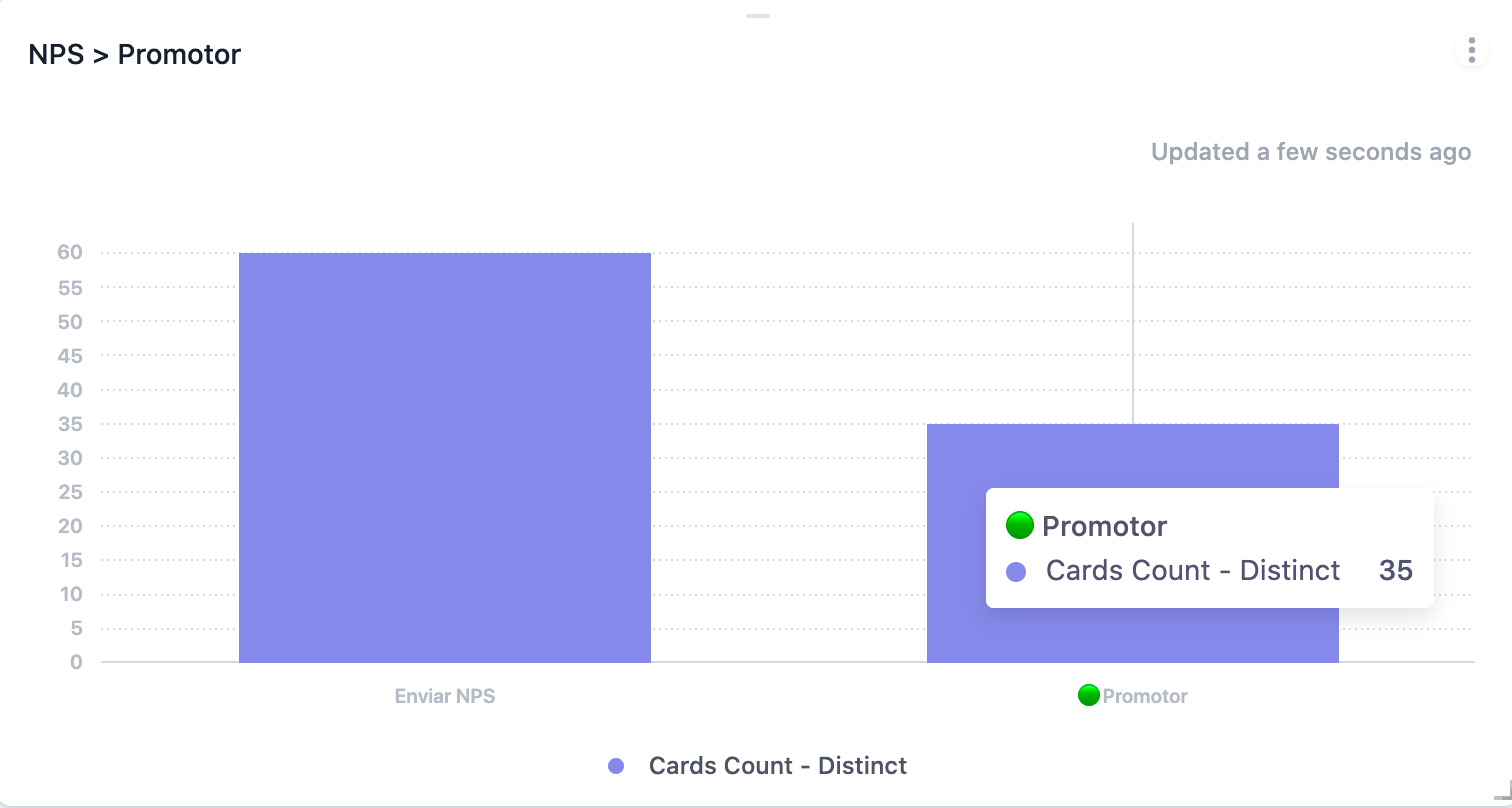
I will try to think in another way, but if we change to "Bar" we will see that:
Send NPS (60) » Promoter (35)
And we will need to do the calculation to see that 58,33%.
Thanks again! and i will try to solve that :)
Hello Mozart.
Thanks for your explanation.
It helps me. It is a good approach. But it is a static approach.
Want I Want to know in the funnel is:
Thanks!
Iñaki
Hi Mozart. One more question.
I realized that the percentage is not Ok in the pie.
Because you sent 60 NPS.
Out of those 60, only 35 turned into promoters.
So the conversion is 35/60 = 58,33%
The problem with the pie is that is a share of two stages.
So, it does 35/ (60 + 35) = 36,8%.
And that is not conversion. Conversion is 58,33%.
Because the reality is that almost 6 people out of 10 that was sent the NPS turned into promoters.
No account yet? Create an account
Enter your E-mail address. We'll send you an e-mail with instructions to reset your password.