News

Usage Stats: Automation Jobs Consumption Anual Graph

  • 9 April 2024
  • 4 replies
  • 24 views
Usage Stats: Automation Jobs Consumption Anual Graph
Userlevel 7

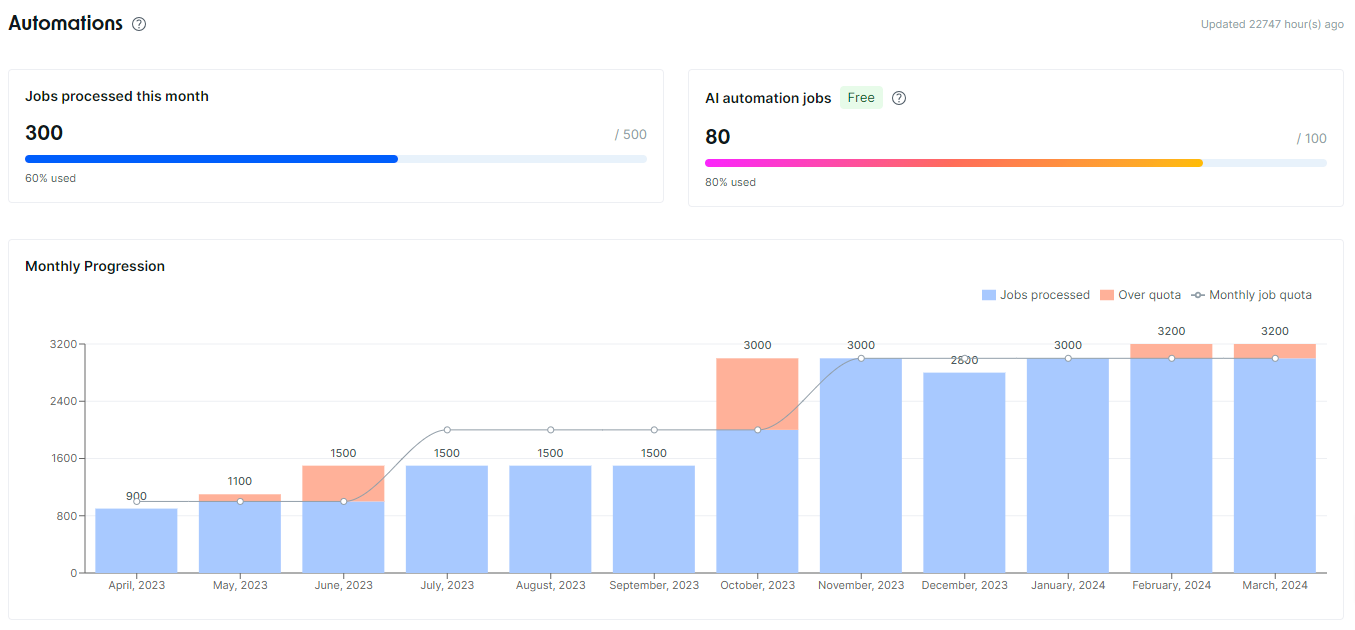
A new feature update in our Usage Stats: the Automation Jobs montly consumption graph!
As a result, you can easily see how you've utilized automation jobs over the last 12 months in comparison to your monthly quota.

🔑Key Highlights:

Yearly Overview: Get a quick glance at your automation jobs consumption trends for the whole year in one nifty graph.
Quota Check: See how your consumption stacks up against your monthly quota.
Dig Deeper: Zoom in and out to dive into consumption patterns.
Smart Decisions: Use this info to tweak your resource usage and budget like a pro.


This feature is now available to all our customers!

Your feedback are welcome! 😉


4 replies

Userlevel 7
Badge +13

It's so helpful! Thanks

Userlevel 7
Badge +18

A new feature update in our Usage Stats: the Automation Jobs montly consumption graph!
As a result, you can easily see how you've utilized automation jobs over the last 12 months in comparison to your monthly quota.

🔑Key Highlights:

Yearly Overview: Get a quick glance at your automation jobs consumption trends for the whole year in one nifty graph.
Quota Check: See how your consumption stacks up against your monthly quota.
Dig Deeper: Zoom in and out to dive into consumption patterns.
Smart Decisions: Use this info to tweak your resource usage and budget like a pro.


This feature is now available to all our customers!

Your feedback are welcome! 😉

👏👏👏👏

Userlevel 7
Badge +13

Hi 
In this report: could add a link to click it and open the automation:


Userlevel 7

Thanks for your feedback Ezequiel!
cc: @helio-bitencourt  

Reply