


👤 For teams that operate and maintain integration flows in production
🔐 Available for customers with the Custom Integrations add-on
🎯 Level: intermediate
Integration flows fail. APIs go down, payloads arrive in unexpected formats, credentials expire, volumes above expectation generate timeouts. The problem is not that failures happen: it is not knowing where to look when they do. Without a diagnostic method, the team wastes time testing random hypotheses while the process sits idle.
This article presents the diagnostic method for Pipefy Integrations: where to find what broke, how to interpret the signals the platform gives, and how to decide which correction to apply.
📖 What you will understand here:
Where to start: the executions panel
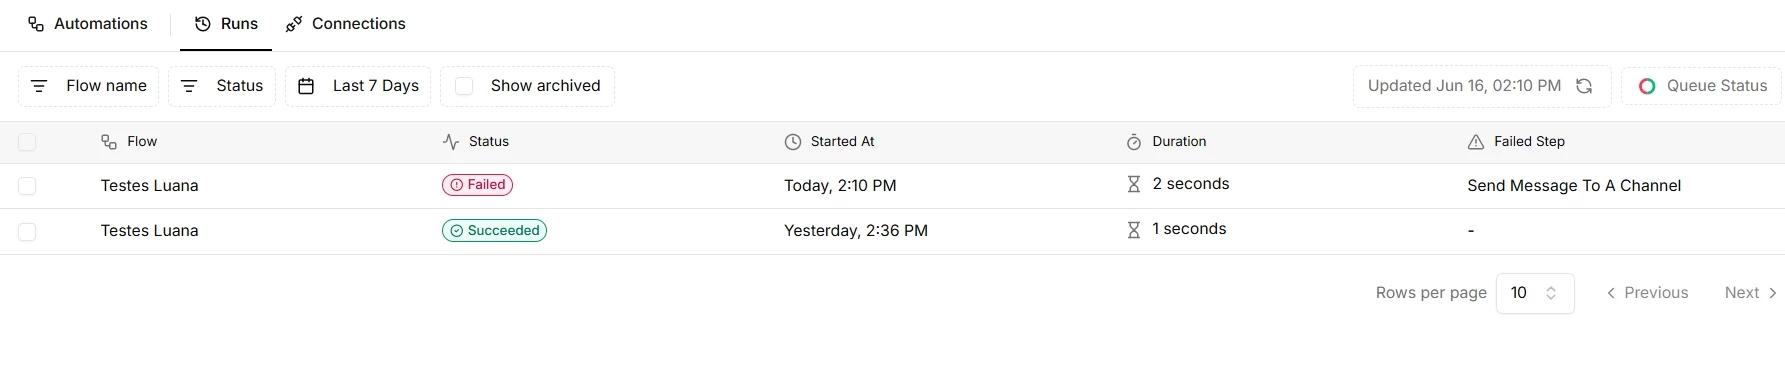
Every flow execution generates a run with its own ID. The executions panel is the entry point for any diagnosis: it lists all runs with status, success, failure, queued, ordered by time. A failure the team reported "just now" has a corresponding run with date and time, and that run contains everything needed to understand what happened.
Each run details the sequence of steps executed, the data that entered each step, the data that came out, and when there is a failure, the error appears as the result returned by the system. The error is always in a specific step. Identifying which step failed is the first action in the diagnostic process: the cause is there or immediately before it, in incorrect data that step received.
The failing step is rarely the real problem. In most cases, the problem is the data that reached it. Before investigating the configuration of the step that failed, examine the output data of the previous step. Bad data in produces bad data out.
Reading HTTP codes: what each range indicates
When the step that failed is a call to an external API, the HTTP status code of the response is the fastest diagnostic available. Each code range corresponds to a class of problem with a different corrective action.
2xx: the call worked
Codes between 200 and 299 indicate that the API received and processed the request correctly. If the flow still did not deliver the expected result, the problem is in the mapping of the response data, not in the call itself. Verify that the field the next step expects is actually present in the returned payload.
4xx: the problem is in the request
400 indicates that the API rejected the request due to incorrect or missing data. Review the payload sent: missing required fields, wrong data types, invalid formats. 401 and 403 are authentication and authorization errors. The token has expired, the API key is incorrect, or the Service Account does not have permission for the requested operation. 404 indicates that the resource was not found: the ID passed does not exist, the URL is wrong, or the record was removed. 429 indicates that the API rate limit was reached. The flow is calling the API too fast and needs rate control.
5xx: the problem is in the external server
Codes 500 to 599 indicate that the external system failed to process the request for internal reasons. The problem is not in the flow. The immediate action is to check the API status with the provider and try again after the system recovers. Automatic retry with interval is the correct response for transient 5xx.
429 and 503 look similar on the surface: the flow fails and the API does not respond as expected. The difference matters for the correction. 429 requires reducing call frequency or distributing volume over time. 503 requires waiting for the external server to recover. Treating both the same way creates flows that keep hitting a rate-limited API or stay in a retry loop against an unavailable one.
Use case: diagnosing a FAILED run on an external call (Pipefy × ERP)
Not every failure should be hidden. When an integration depends on an external system, the failure needs to appear so that the person operating the flow knows exactly what to fix. This use case shows a flow that fails on purpose in a real scenario, and teaches you how to read that `FAILED` in the executions tab in Pipefy Integrations, using the fastest diagnostic available: the HTTP status code.
The scenario
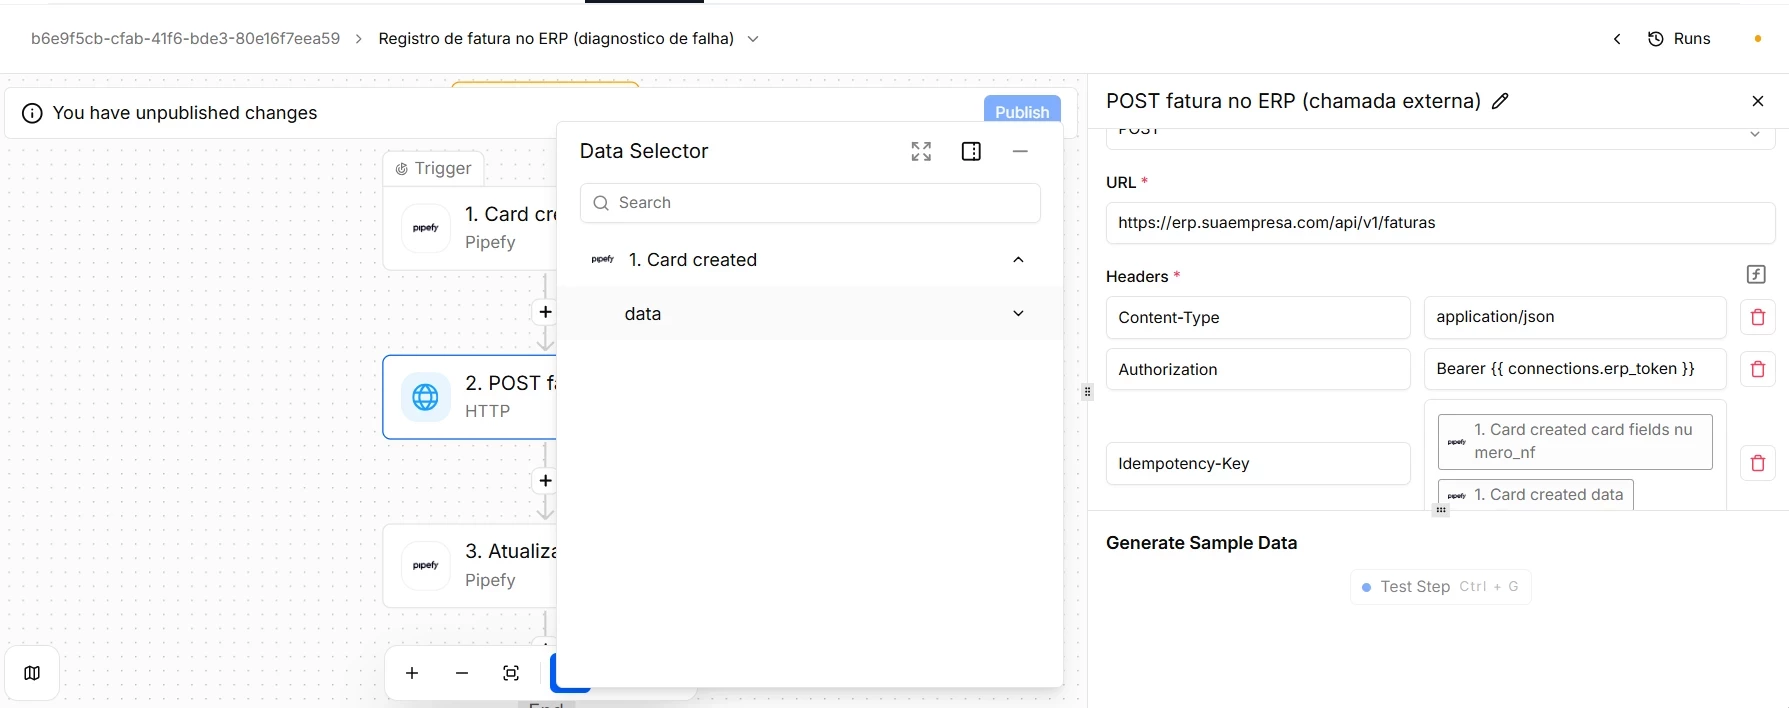
A card is created in Pipefy representing an approved invoice. The flow then registers that invoice in the company ERP via an HTTP call and, on return, updates the card itself with the reference generated by the ERP.
The fragile point, and this holds for any integration, is the external call. The ERP may reject the data, require reauthentication, be down, or apply rate limiting. When that happens, the HTTP step fails, the next step does not run, and the entire run is marked as `FAILED` in the Executions tab. That `FAILED` is what we learn to interpret here.
Why this run appears as FAILED (and why that is a good thing)
In the HTTP step, `Continue on Failure` is left off. This is intentional: when the ERP call fails, we want the execution to stop and be flagged as `FAILED`, rather than continuing as if everything went fine. A visible failure is a failure that can be corrected; a silent failure becomes a finance problem weeks later.
`Retry on Failure` is kept on to absorb passing instability, a transient 5xx or 429 resolves itself. But if retries are exhausted, or if the error is the type that no retry resolves, a 4xx, the run goes to `FAILED`, and that is when human diagnosis takes over.
How to analyze the FAILED run in the Runs tab
- Open the Executions tab and filter by status `FAILED`.
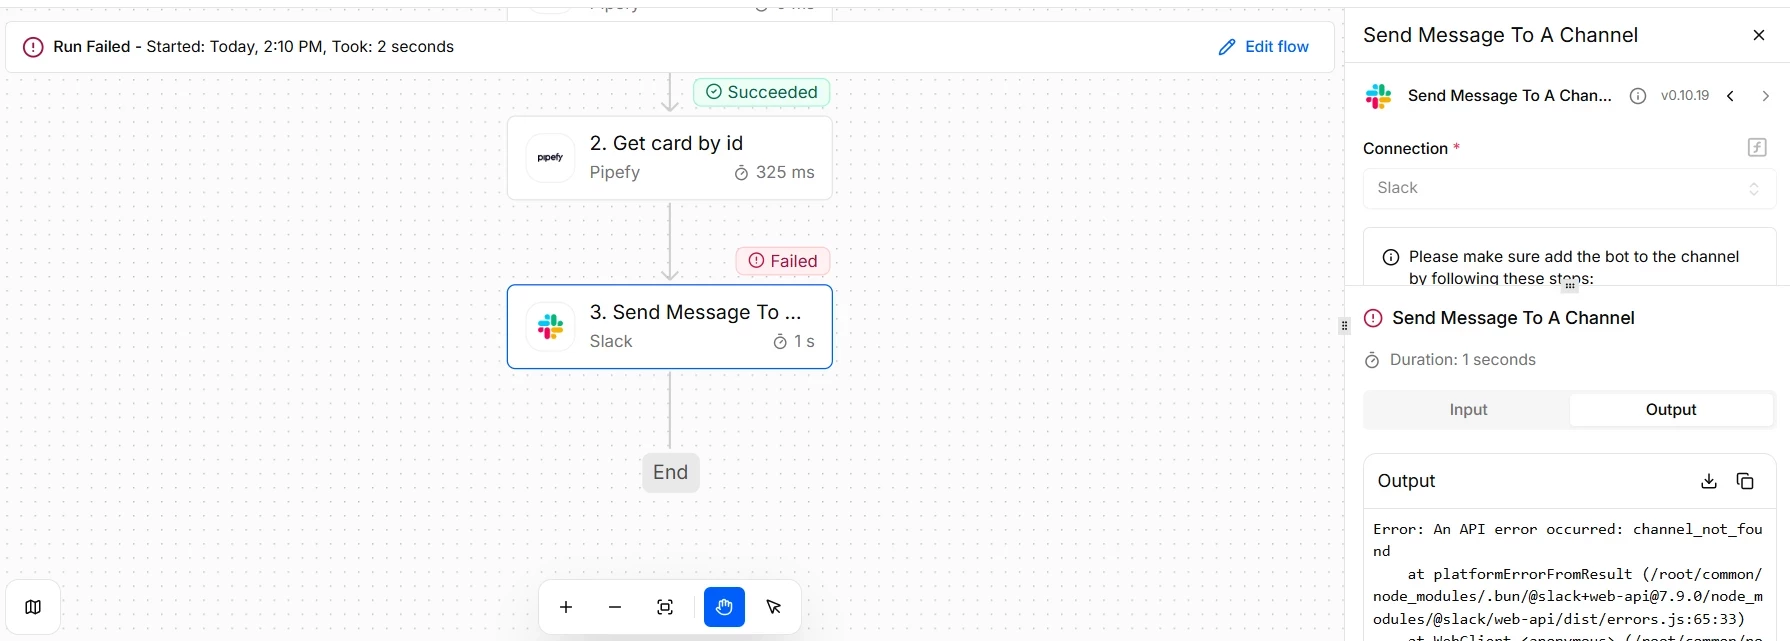
- Click on the failed run and flow. The product highlights the step that failed, in red, in this case the `POST invoice to ERP`.
- Open the output of that step. There you will find the `errorMessage` and, most important in an HTTP call, the status code of the response.
- Read the code by range and apply the corresponding corrective action. Do not blindly re-execute: the code tells you whether it makes sense to try again or whether something needs to be corrected first.
Recommendations and best practices
- Configure retry by error class. `Retry on Failure` is right for transient 5xx and 429, but it does not fix 4xx. For request errors, the path is to adjust the data, not repeat the call. For finer control, capture the status using Error handling.
- For 429, control the rate, not the insistence. Distribute the volume, chunking, delay between calls, rather than just retrying faster.
- Treat the execution as idempotent so that re-executing is safe. This is the point that ties everything together. When you re-execute a `FAILED` run, or when the automatic retry fires, the side effects of a call that was processed before the response was lost may be reapplied. That is why the ERP call carries an `Idempotency-Key`, here the invoice number: the ERP recognizes the key and, on a resend, returns the existing record instead of creating a second one. On the Pipefy side, the same principle applies. Before creating a card, search by the unique key, the search-before-create pattern. This way, diagnosing and re-executing never generates duplicates.
Transient failure or structural failure: the distinction that defines the correction
Not every failure requires a change to the flow. Many production failures are transient: the external system was momentarily unavailable, the network had instability, the rate limit was hit by an unusual volume spike. In those cases, the flow is correct and the correction is simply to reprocess the run after the external condition resolves, using the reexecution options the product provides.
Structural failures have a different pattern: the same type of error appears consistently, across multiple runs, with the same input data. A field that always arrives empty, a mapping that always produces the wrong data type, a Router condition that is never true. In those cases, reprocessing does not fix it: the flow needs to be corrected before the retry.
Reprocessing a run with Retry on Latest Version when the problem was transient and no change was made to the flow creates a duplicate run with the risk of duplicate data in the destination system: two records created, two emails sent, two updates applied. Use Retry from Failed Step for transient failures. Use Retry on Latest Version only after correcting the flow.
Practices that reduce diagnostic time
Effective production troubleshooting starts during the build phase. Well-built flows are easier to diagnose because they leave clear traces of where and why they failed.
Document each step with comments. Name of the system being called, purpose of the call, expected input and output structure. A step without context is a step that takes ten minutes to understand during a high-pressure diagnosis.
Handle missing data explicitly. A Router that verifies whether a field exists before using it not only protects the flow from failures: it also pinpoints exactly where the missing data was detected, which accelerates diagnosis when the problem is upstream.
Use descriptive names for steps. "Create record in Legal ERP" is an immediate diagnosis in the Executions panel. "HTTP 2" is not.
Never store credentials directly in code or in configuration text fields. Credentials expire, change, and need to be updated in one place only. Always use authenticated connections or the Variables option in Pipefy Integrations.
Before moving on, confirm that you understand:
☐ Where to start the diagnosis when a flow fails in production
☐ What each HTTP code range indicates and what action it calls for
☐ The difference between a transient failure and a structural failure, and how each one affects the retry choice
☐ Why documenting steps during the build phase reduces diagnostic time