

Here at our company NTech, we have developed Analytics projects for customers using Pipefy and Qlik Sense. Qlik Sense is a complete data analysis platform that has established a benchmark for a new generation of analytics widely used by organizations worldwide. I didn't find any reading on the topic, so I decided to talk here a little about the use of Qlik Sense to build analytical panels with Pipefy data through GraphQL based APIs.
Qlik Sense has the ability to access data from a wide list of data sources, whether structured or unstructured. To access Pipefy data via the GraphQL API, we use a REST connector, native to the tool. I even wrote an article some time ago called "GraphQL: How to use the Evolution of Web APIs in Qlik Sense" (written in Portuguese).
In this article we will cover the basic concepts, since in Pipefy we have a series of objects such as Pipes, Cards, Phases, Phases History, Labels, Tables, Records, Cards Fields, among others, as well as issues such as data pagination.
A nice thing about Qlik Sense is that we can read all these objects individually and then store them in QVD format (data file in Qlik format) and from these QVDs build the desired views integrating all objects.
Initially we need to define our data loads and logically have the access token already in hand.
1st Load: List of Pipes
We built our GraphyQL Query, according to Pipefy documentation:
{"query":"{ organizations { id name created_at pipes(include_publics: true) { id name } } }"}
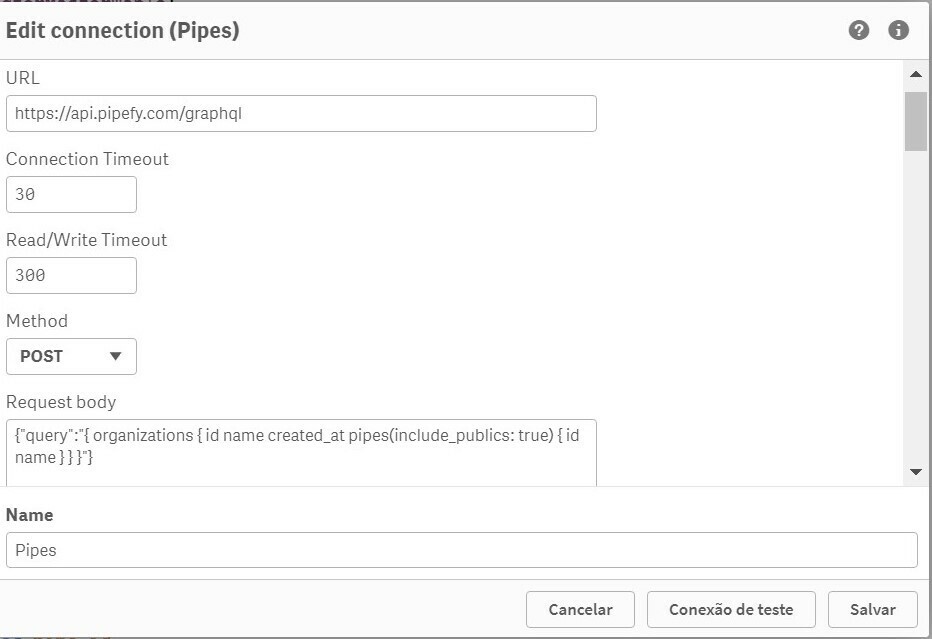
Then we created a REST connection, parameterizing it according to the images below:
Inserting API URL and our GraphQL query into the Request Body:
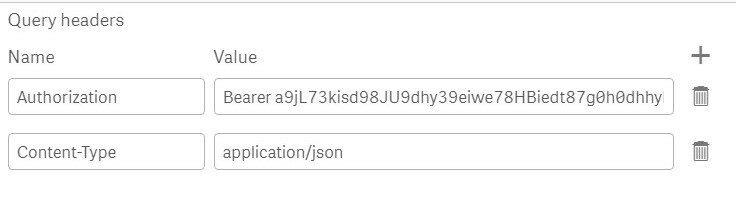
And Inserting you Token in Query Headers:
Then give your connection a name (like "pipes") and save.
Then, create another REST connection, this time to consult the Cards of our Pipe "Gestão de Trabalho Remoto". It is important to know the Pipe ID.
2nd Load: List of Pipe Cards "Gestão de Trabalho Remoto" ID 301532736
Again, we built our new GraphyQL Query, according to Pipefy documentation:
{"query":"{allCards(pipeId:301532736){ edges { node { id title due_date current_phase {name} pipe {id} } } } } "}
In this case, follow all the procedures of the 1st Load, changing only the GraphQL query in the Request Body, and save as the connection with another name (like "cards").
We can make several loads using only a single REST connection, dynamically changing the parameters in the load script, using the WITH CONNECTION statement. However, we will not cover the use of WITH CONNECTION in this article.
Then build the script for the two loads (pipes and cards), through the automatic generation of the connectors (Select Data).
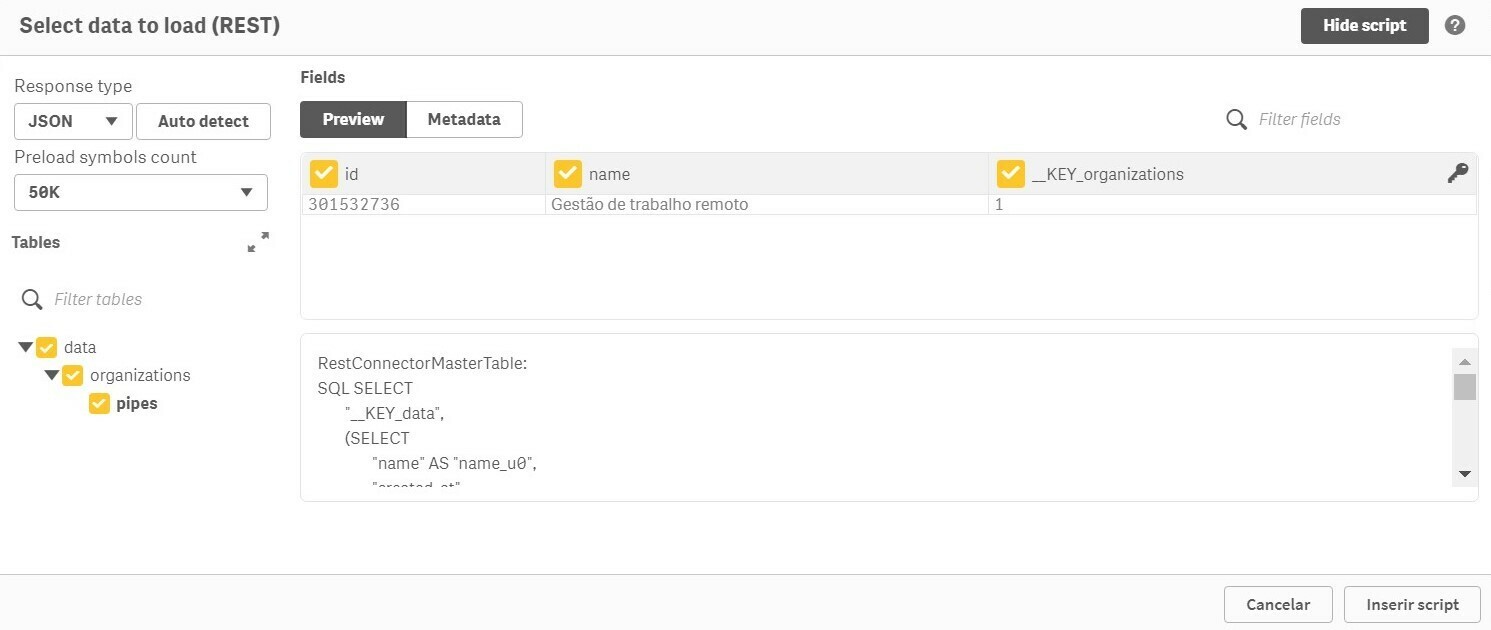
It is necessary to adjust the names of the fields so that the data model does not have conflicts and to generate the associative model correctly.
Here are the scripts for the 2 loads:
Pipe Script:
/*
'
LIB CONNECT TO 'Pipes';

RestConnectorMasterTable:
SQL SELECT
    "__KEY_data",
    (SELECT
        "id" AS "id_u0",
        "name" AS "name_u0",
        "created_at",
        "__KEY_organizations",
        "__FK_organizations",
        (SELECT
            "id",
            "name",
            "__FK_pipes"
        FROM "pipes" FK "__FK_pipes")
    FROM "organizations" PK "__KEY_organizations" FK "__FK_organizations")
FROM JSON (wrap off) "data" PK "__KEY_data";

[organizations]:
LOAD
    [id_u0] AS organization_id,
    [name_u0] AS organization_name,
    [created_at] AS organization_created_at,
    [__KEY_organizations],
    [__FK_organizations] AS [__KEY_data]
RESIDENT RestConnectorMasterTable
WHERE NOT IsNull([__FK_organizations]);

[pipes]:
LOAD
    [id] as pipe_id,
    [name] as pipe_name,
    [__FK_pipes] AS [__KEY_organizations]
RESIDENT RestConnectorMasterTable
WHERE NOT IsNull([__FK_pipes]);
Left Join(pipes)
LOAD
    organization_id,
    organization_name,
    [__KEY_organizations]
RESIDENT [organizations];

DROP TABLE RestConnectorMasterTable;
DROP TABLE [organizations];
DROP Field [__KEY_organizations] From [pipes];
'
*/
Cards Script:
/*
LIB CONNECT TO 'Cards';

RestConnectorMasterTable:
SQL SELECT
    "__KEY_data",
    (SELECT
        "__KEY_allCards",
        "__FK_allCards",
        (SELECT
            "__KEY_edges",
            "__FK_edges",
            (SELECT
                "id" AS "id_u0",
                "title",
                "due_date",
                "__KEY_node",
                "__FK_node",
                (SELECT
                    "name",
                    "__FK_current_phase"
                FROM "current_phase" FK "__FK_current_phase"),
                (SELECT
                    "id",
                    "__FK_pipe"
                FROM "pipe" FK "__FK_pipe")
            FROM "node" PK "__KEY_node" FK "__FK_node")
        FROM "edges" PK "__KEY_edges" FK "__FK_edges")
    FROM "allCards" PK "__KEY_allCards" FK "__FK_allCards")
FROM JSON (wrap off) "data" PK "__KEY_data";

[cardpipe]:
LOAD
    [id] as pipe_id,
    [__FK_pipe] AS [__KEY_node]
RESIDENT RestConnectorMasterTable
WHERE NOT IsNull([__FK_pipe]);

[current_phase]:
LOAD
    [name] as current_phase_name,
    [__FK_current_phase] AS [__KEY_node]
RESIDENT RestConnectorMasterTable
WHERE NOT IsNull([__FK_current_phase]);


[cards]:
LOAD
    [id_u0] as card_id,
    [title] as card_title,
    [due_date] as card_due_date,
    [__KEY_node]
RESIDENT RestConnectorMasterTable
WHERE NOT IsNull([__FK_node]);
Left Join(cards)
LOAD
    current_phase_name,
    [__KEY_node]
RESIDENT [current_phase];
Left Join(cards)
LOAD
    pipe_id,
     [__KEY_node]
RESIDENT [cardpipe];

DROP TABLE RestConnectorMasterTable;
DROP Table [cardpipe];
DROP TABLE [current_phase];
DROP Field  [__KEY_node]from cards;
*/
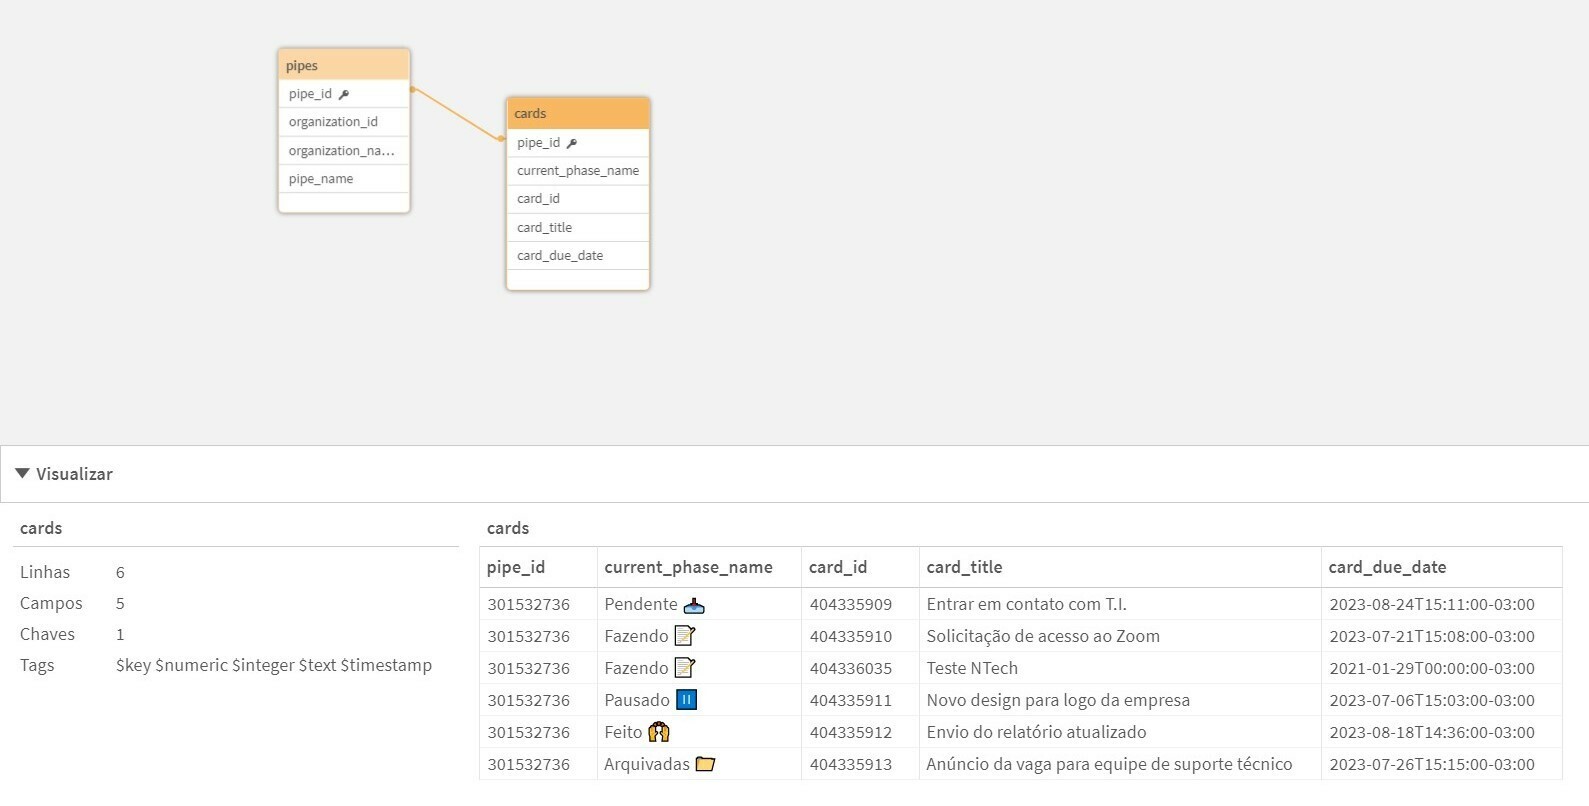
Once the data model is loaded, it will look like this:
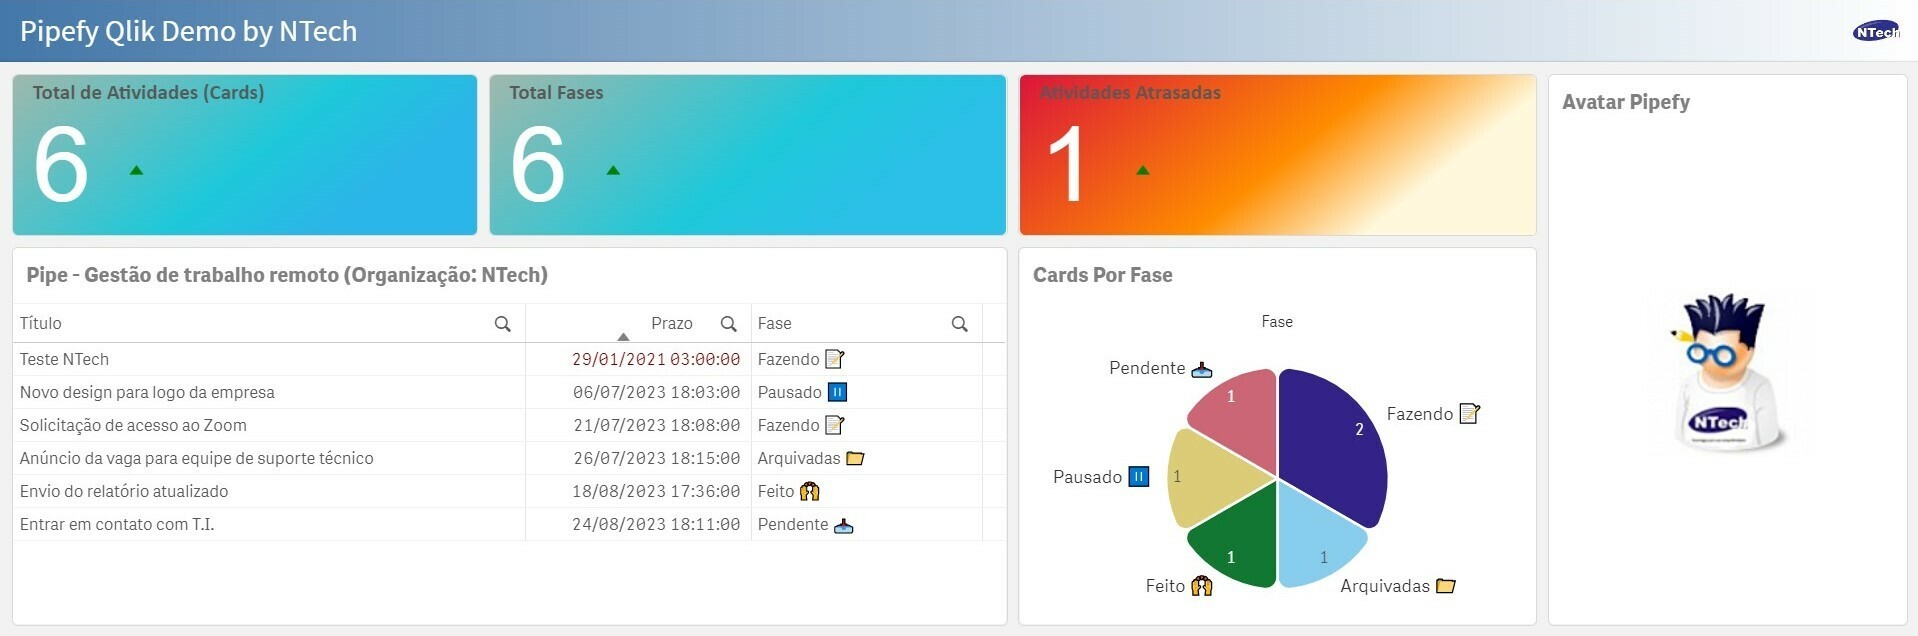
And finally we can make our panels, like the example below:
That's it! See you the next!
