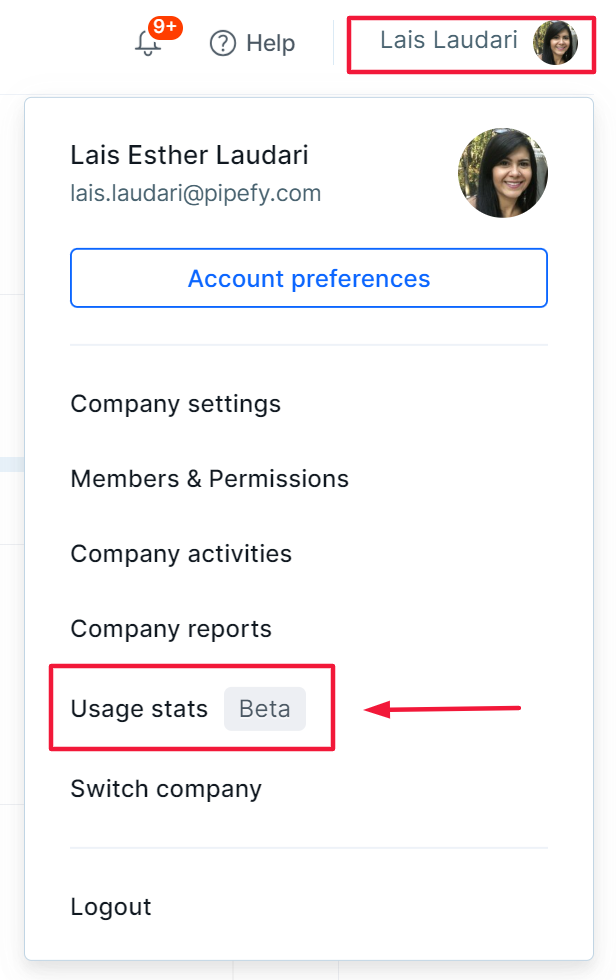
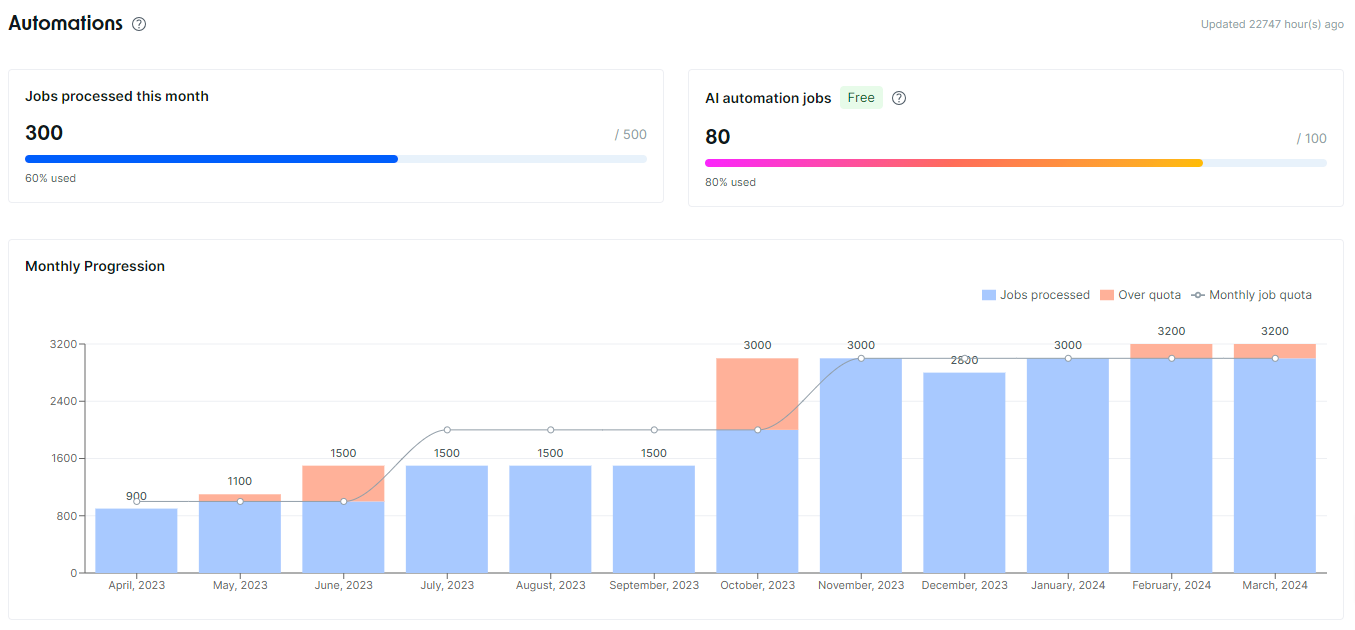
A new feature update in our Usage Stats: the Automation Jobs montly consumption graph!
As a result, you can easily see how you've utilized automation jobs over the last 12 months in comparison to your monthly quota.
🔑Key Highlights:
Yearly Overview: Get a quick glance at your automation jobs consumption trends for the whole year in one nifty graph.
Quota Check: See how your consumption stacks up against your monthly quota.
Dig Deeper: Zoom in and out to dive into consumption patterns.
Smart Decisions: Use this info to tweak your resource usage and budget like a pro.
This feature is now available to all our customers!
Your feedback are welcome! 😉