Creating Dashboards in Pipefy

Creating Dashboards in Pipefy
Juliana Spinardi
Pipefy Staff
Forum|alt.badge.img+8

It is the first Tuesday of the year, and I'm happy to start the day with new content for the community members. 

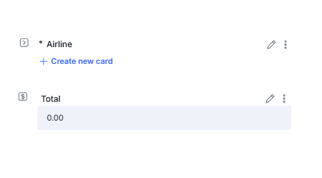
Today I want to share with you how to set up and create dashboards using Pipefy! Check out this quick video and start to see and measure your processes. 

Happy Tuesday, everyone! 


https://www.youtube.com/watch?v=1sgd1lAEzdA&feature=youtu.be


Did this topic help you find an answer to your question?

2 replies

Forum|alt.badge.img+4
  • New Member
  • 66 replies
  • November 16, 2024

Hi how can I build a Dashboard for Travel: Average Price for tickets, Average time per Phase, Bar Graph with the Price for the diffrent airlines 


  • New Member
  • 2 replies
  • November 20, 2024

That's an awesome way to kick off the year! Dashboards in Pipefy are a game-changer for tracking and measuring processes effectively. The video will be super helpful for anyone looking to get started—creating customized dashboards can give clear insights into workflows and help teams make data-driven decisions. Thanks for sharing such valuable content with the community!


Cookie policy

We use cookies to enhance and personalize your experience. If you accept you agree to our full cookie policy. Learn more about our cookies.

 
Cookie settings