I’m trying to calculate the average time a card spends in each phase. However, I'm noticing that the results change depending on the configuration.
—specifically when I add or remove "Phase Name" or "Current" from the Dimensions. When "Phase Name" is selected & “Current Phase” is added to the filters, the figures are different
Could you please clarify:
What exactly do "Phase Name" and "Current Phase" mean in this context?
What is the correct way to structure this to get an accurate average time per phase?
And do the date filters actually work:
Best answer by joao-quint
Hi,
Great questions! Pipefy’s reporting (Insights) can be a bit tricky when it comes to interpreting "Phase Name" and "Current Phase", especially in Lead Time / Average time per phase reports. Let’s clarify:
✅ Key Concepts Explained
🔹 Phase Name (as a Dimension):
Represents any phase the card has passed through.
When used in the report, it breaks down the data by each phase the card entered — regardless of whether it's the current phase or not.
✅ Use this to get accurate average time per phase, historically.
ℹ️ Example: A card that went through “Review”, “Approval” and “Completed” will be counted once in each if Phase Name is in the Dimension.
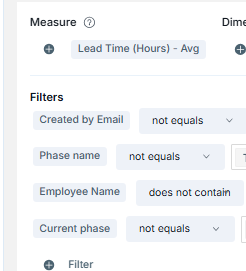
🔹 Current Phase (as a Filter):
Refers only to the current phase where the card is now.
❗ When added as a filter, your report will only show cards that are currently in that specific phase, which is usually not what you want when calculating average time per phase historically.
⚠️ This filter will skew the results, because it excludes all completed cards or cards that already left the phase.
🧠 So, what happens when you combine both?
Configuration
Result
Phase Name in Dimension only
✅ Shows average time per phase (correct)
Phase Name + Current Phase filter
❌ Shows only cards that are still in that phase — results get distorted
No Phase Name, only Lead Time
❌ Shows total lead time, not per phase
✅ Best Practice for “Average Time per Phase” Report
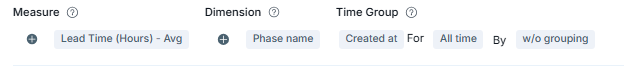
Measure: Lead Time (Hours) - Avg
Dimension: Phase Name
Time Group: Created at, select appropriate period (e.g., Last 30 days)
Do not add "Current Phase" filter
Optionally: Add other filters like Pipe, Label, or Field to narrow down by process or type of request
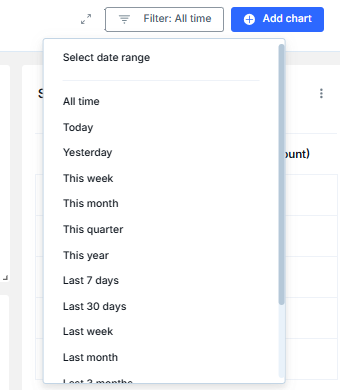
🔎 Do the Date Filters Work?
Yes — but with nuances:
When you choose a time filter (like “Last 30 days”), you're usually filtering by the card's creation date.
If you want to filter when the card passed through a phase, you'd need to use "Time Group: Entered at" or “Exited at” instead of just “Created at”.
📌 However, these options are limited depending on your Pipefy Insights version and metrics available in the report builder.
✅ Example configuration for accurate result
Measure: Lead Time (Hours) - Avg
Dimension: Phase Name
Time Group: Entered at → Last 30 days
No filter for Current Phase
Grouping: w/o grouping (unless you want daily/weekly breakdown)
🔚 Summary
Component
Use it?
Purpose
Phase Name (Dimension)
✅ Yes
To break results by phase
Current Phase (Filter)
❌ No
Only use when interested in where cards are now
Date Filters
✅ Yes (with correct Time Group)
Filters by when card was created/entered/exited a phase
Great questions! Pipefy’s reporting (Insights) can be a bit tricky when it comes to interpreting "Phase Name" and "Current Phase", especially in Lead Time / Average time per phase reports. Let’s clarify:
✅ Key Concepts Explained
🔹 Phase Name (as a Dimension):
Represents any phase the card has passed through.
When used in the report, it breaks down the data by each phase the card entered — regardless of whether it's the current phase or not.
✅ Use this to get accurate average time per phase, historically.
ℹ️ Example: A card that went through “Review”, “Approval” and “Completed” will be counted once in each if Phase Name is in the Dimension.
🔹 Current Phase (as a Filter):
Refers only to the current phase where the card is now.
❗ When added as a filter, your report will only show cards that are currently in that specific phase, which is usually not what you want when calculating average time per phase historically.
⚠️ This filter will skew the results, because it excludes all completed cards or cards that already left the phase.
🧠 So, what happens when you combine both?
Configuration
Result
Phase Name in Dimension only
✅ Shows average time per phase (correct)
Phase Name + Current Phase filter
❌ Shows only cards that are still in that phase — results get distorted
No Phase Name, only Lead Time
❌ Shows total lead time, not per phase
✅ Best Practice for “Average Time per Phase” Report
Measure: Lead Time (Hours) - Avg
Dimension: Phase Name
Time Group: Created at, select appropriate period (e.g., Last 30 days)
Do not add "Current Phase" filter
Optionally: Add other filters like Pipe, Label, or Field to narrow down by process or type of request
🔎 Do the Date Filters Work?
Yes — but with nuances:
When you choose a time filter (like “Last 30 days”), you're usually filtering by the card's creation date.
If you want to filter when the card passed through a phase, you'd need to use "Time Group: Entered at" or “Exited at” instead of just “Created at”.
📌 However, these options are limited depending on your Pipefy Insights version and metrics available in the report builder.
✅ Example configuration for accurate result
Measure: Lead Time (Hours) - Avg
Dimension: Phase Name
Time Group: Entered at → Last 30 days
No filter for Current Phase
Grouping: w/o grouping (unless you want daily/weekly breakdown)
🔚 Summary
Component
Use it?
Purpose
Phase Name (Dimension)
✅ Yes
To break results by phase
Current Phase (Filter)
❌ No
Only use when interested in where cards are now
Date Filters
✅ Yes (with correct Time Group)
Filters by when card was created/entered/exited a phase