
Can you help me in designing a Conversion Funnel Dashboard in Dashboard Beta?

Solved
Conversion Funnel in Dashboard Beta
Best answer by mozart-morales
Hi
I will share what i did after our workshop and you can see if that will help you.
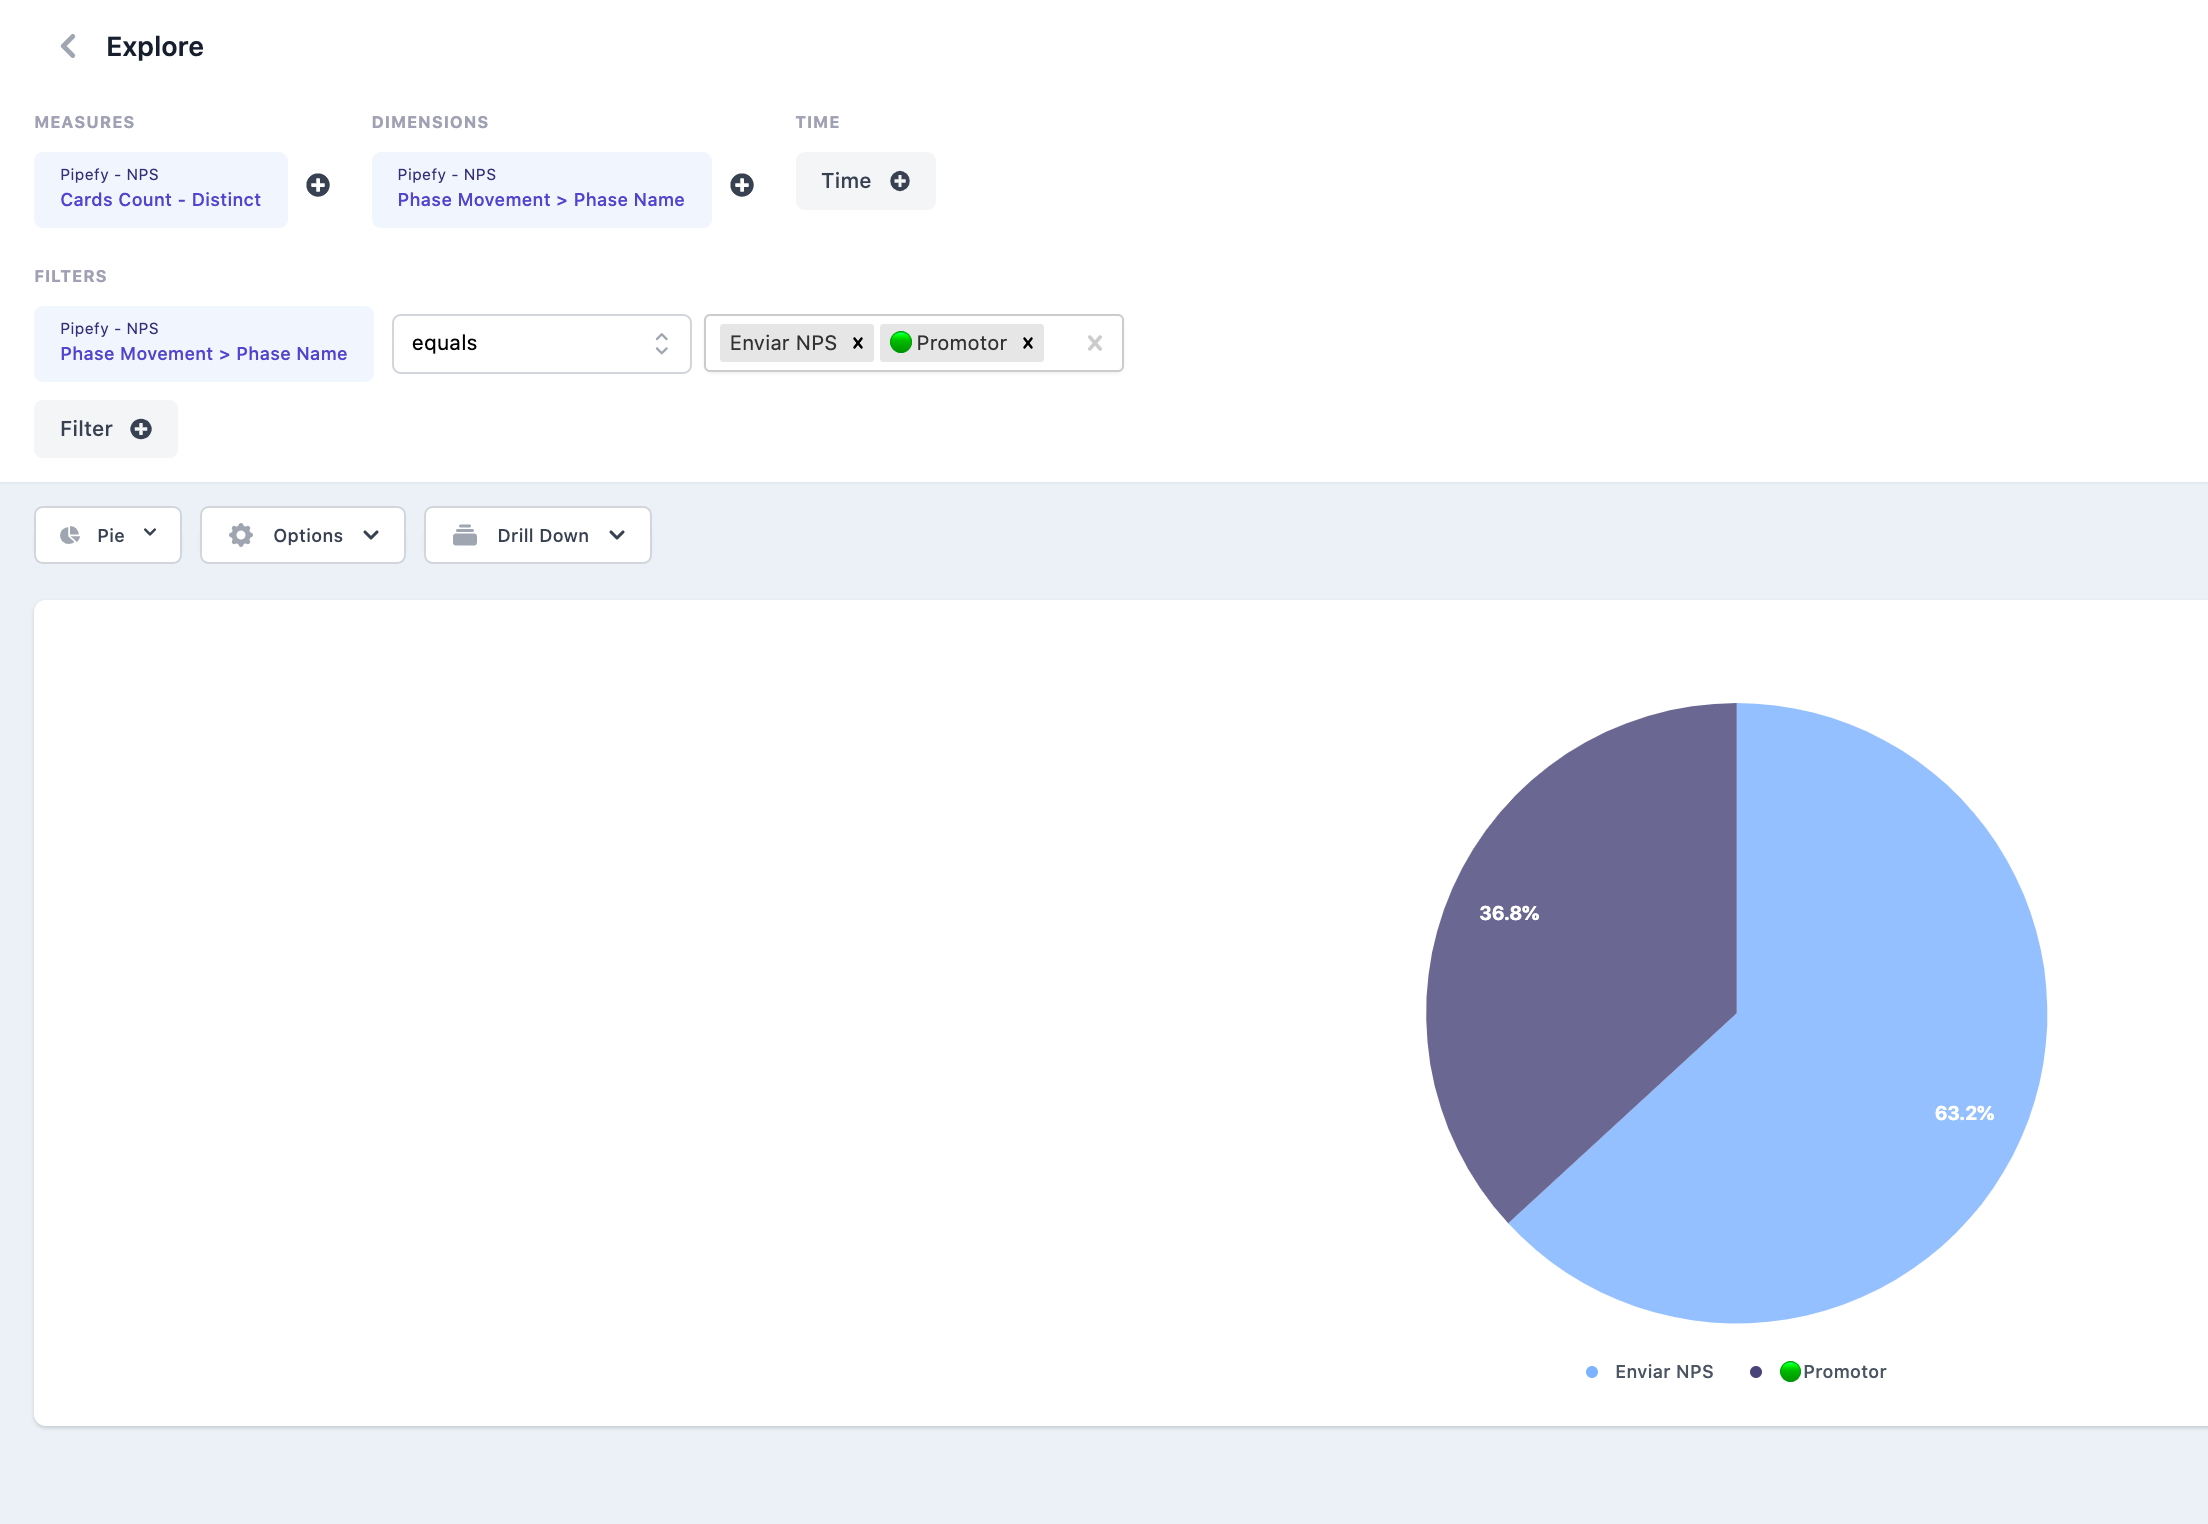
Step 1:
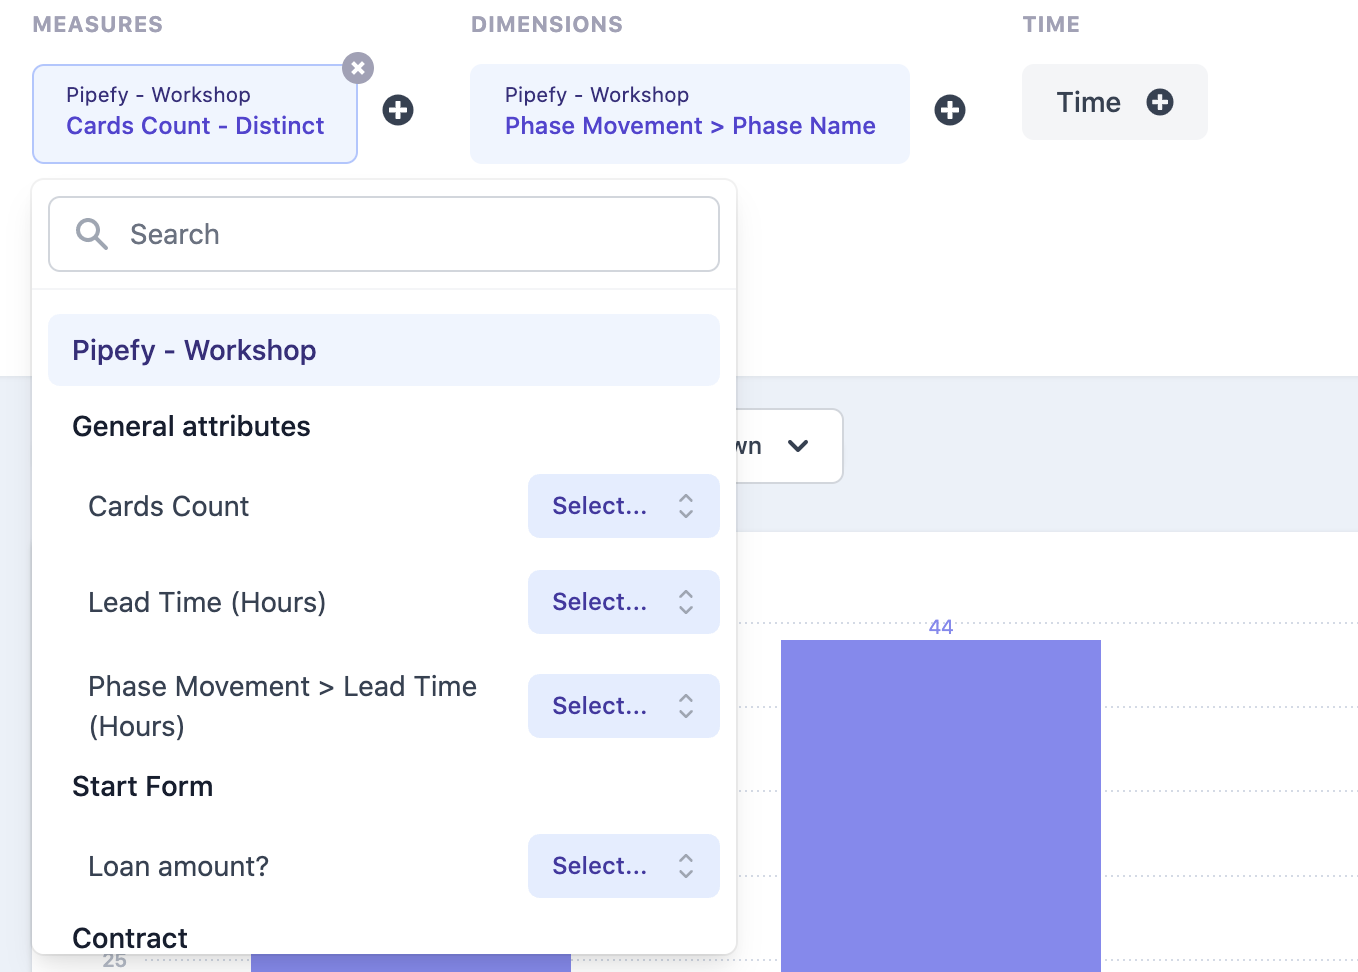
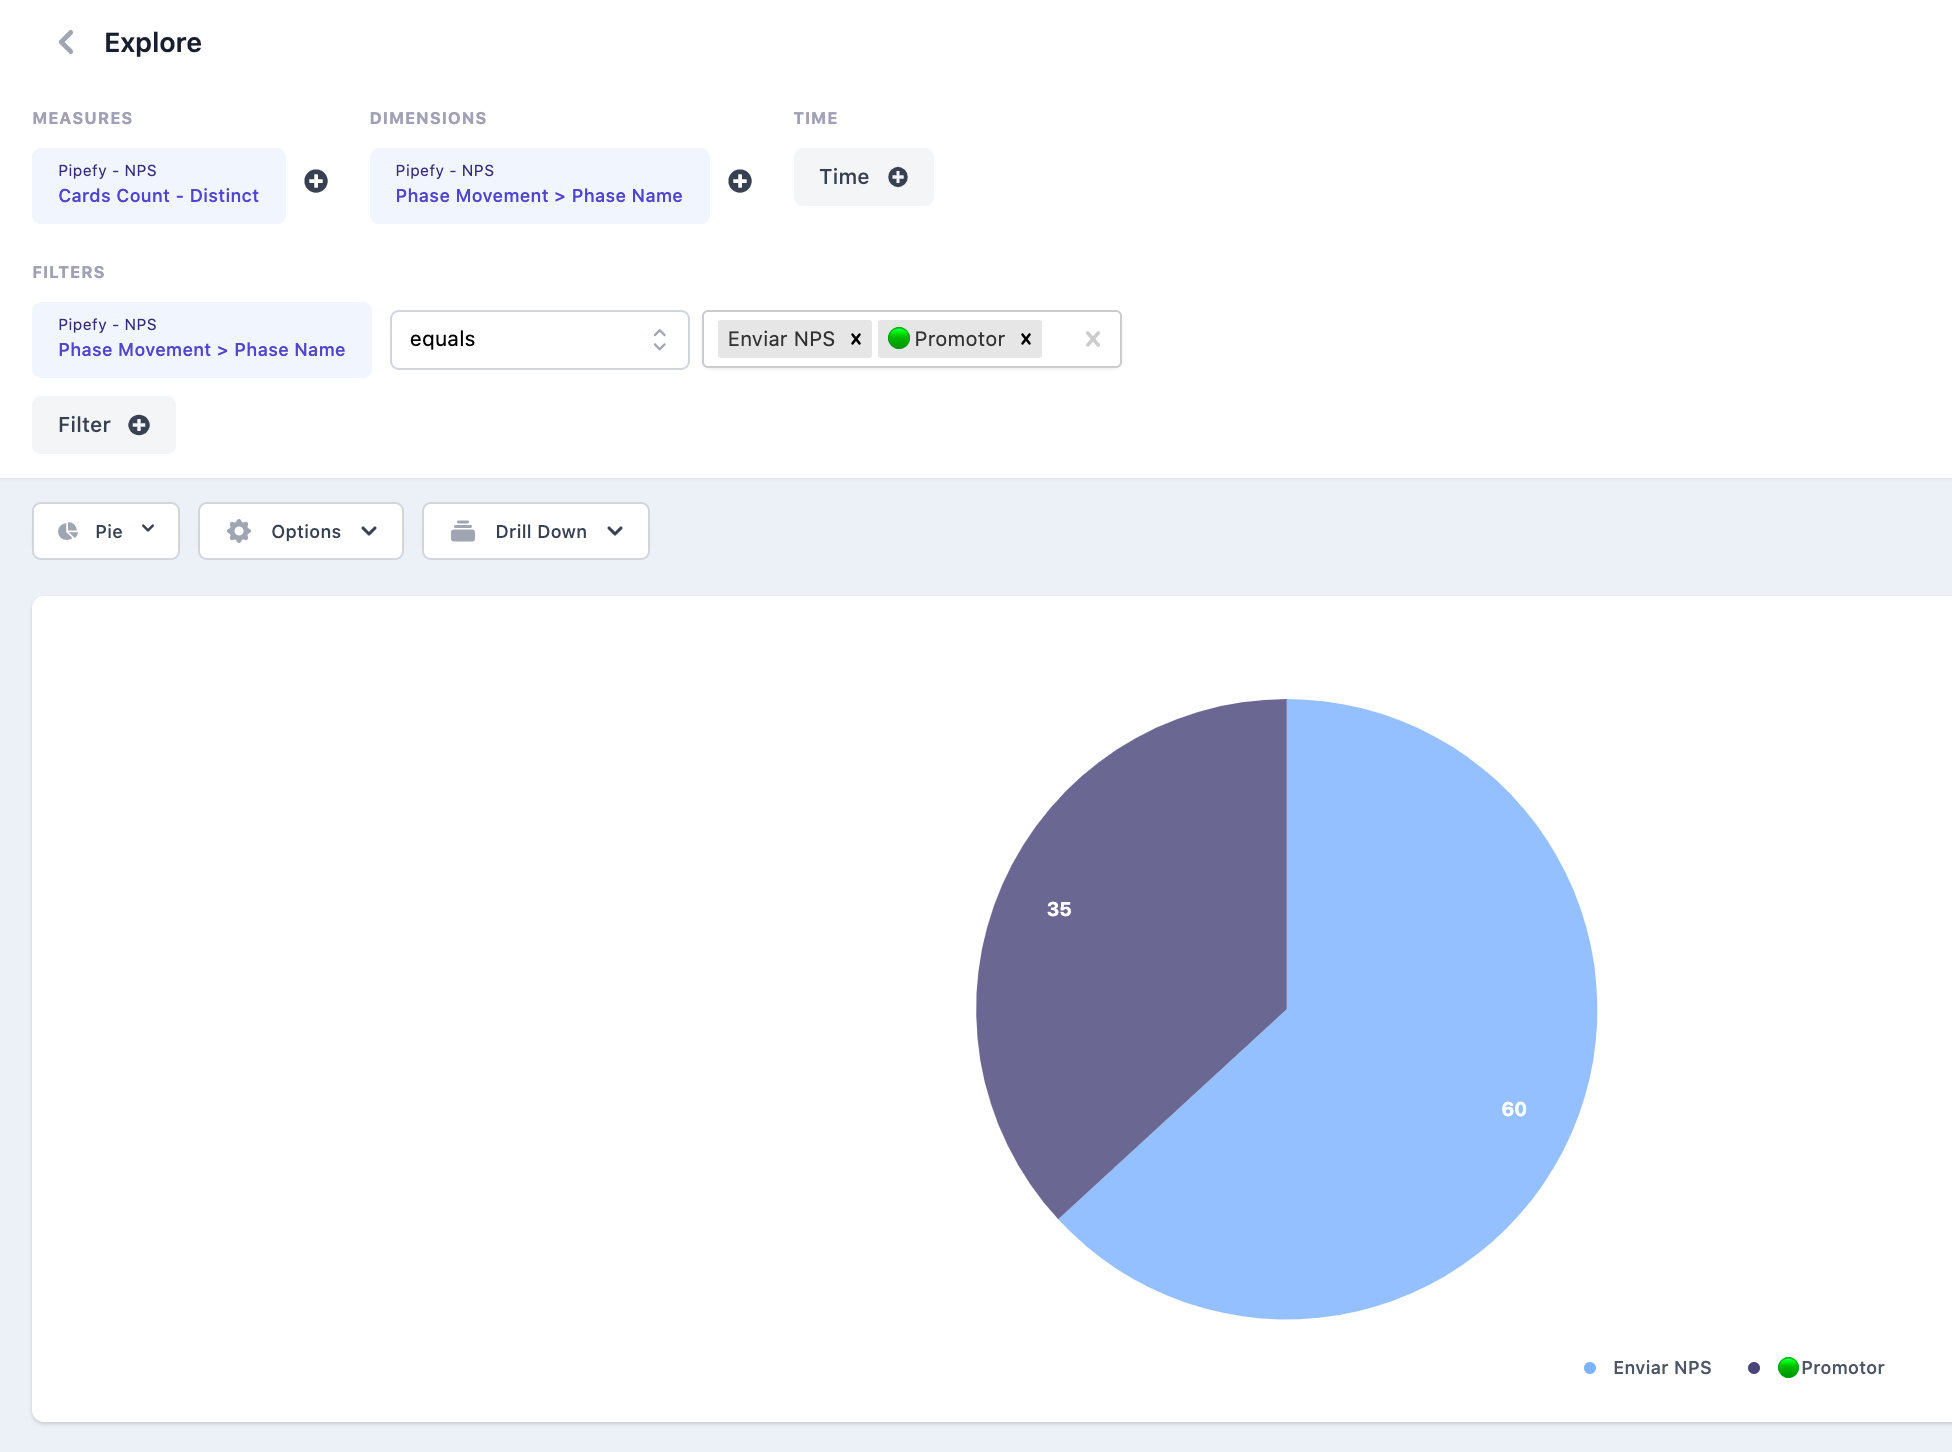
Define what you would like to measure: in my case i would like to count distinct cards in each phase, so first my measure will be "Cards Count - Distinct"
Step 2:
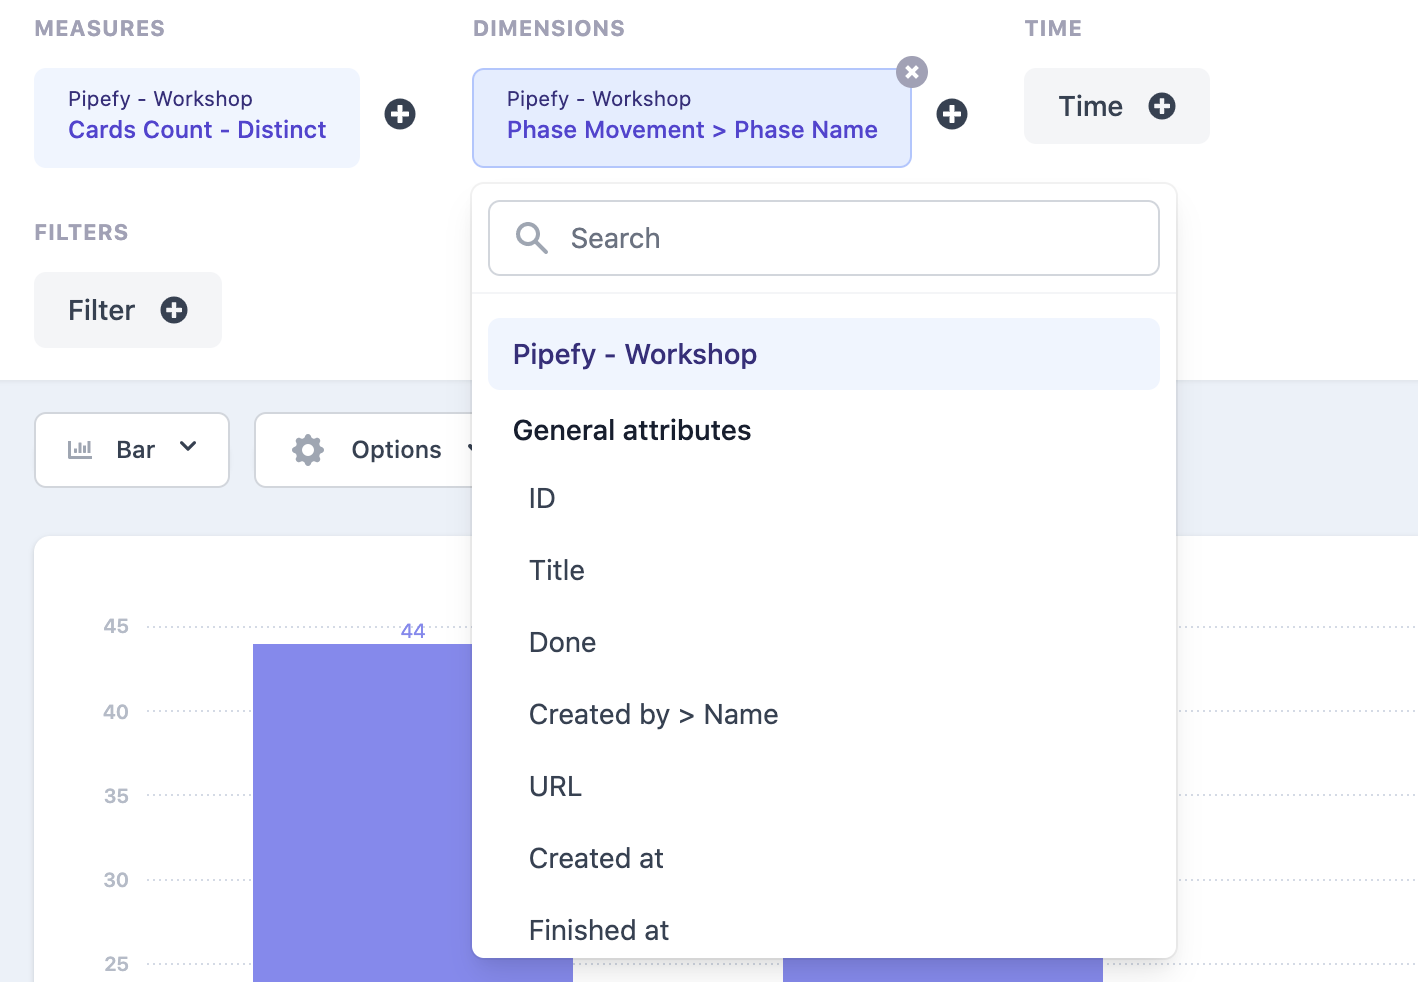
Define dimension: in my case i would like to see cards in each phase movement, so my dimension will be "Phase movement > Phase Name"
Step 3:
Time, in my case i will not add any specific date but you can add if you want
After that i will be able to see:
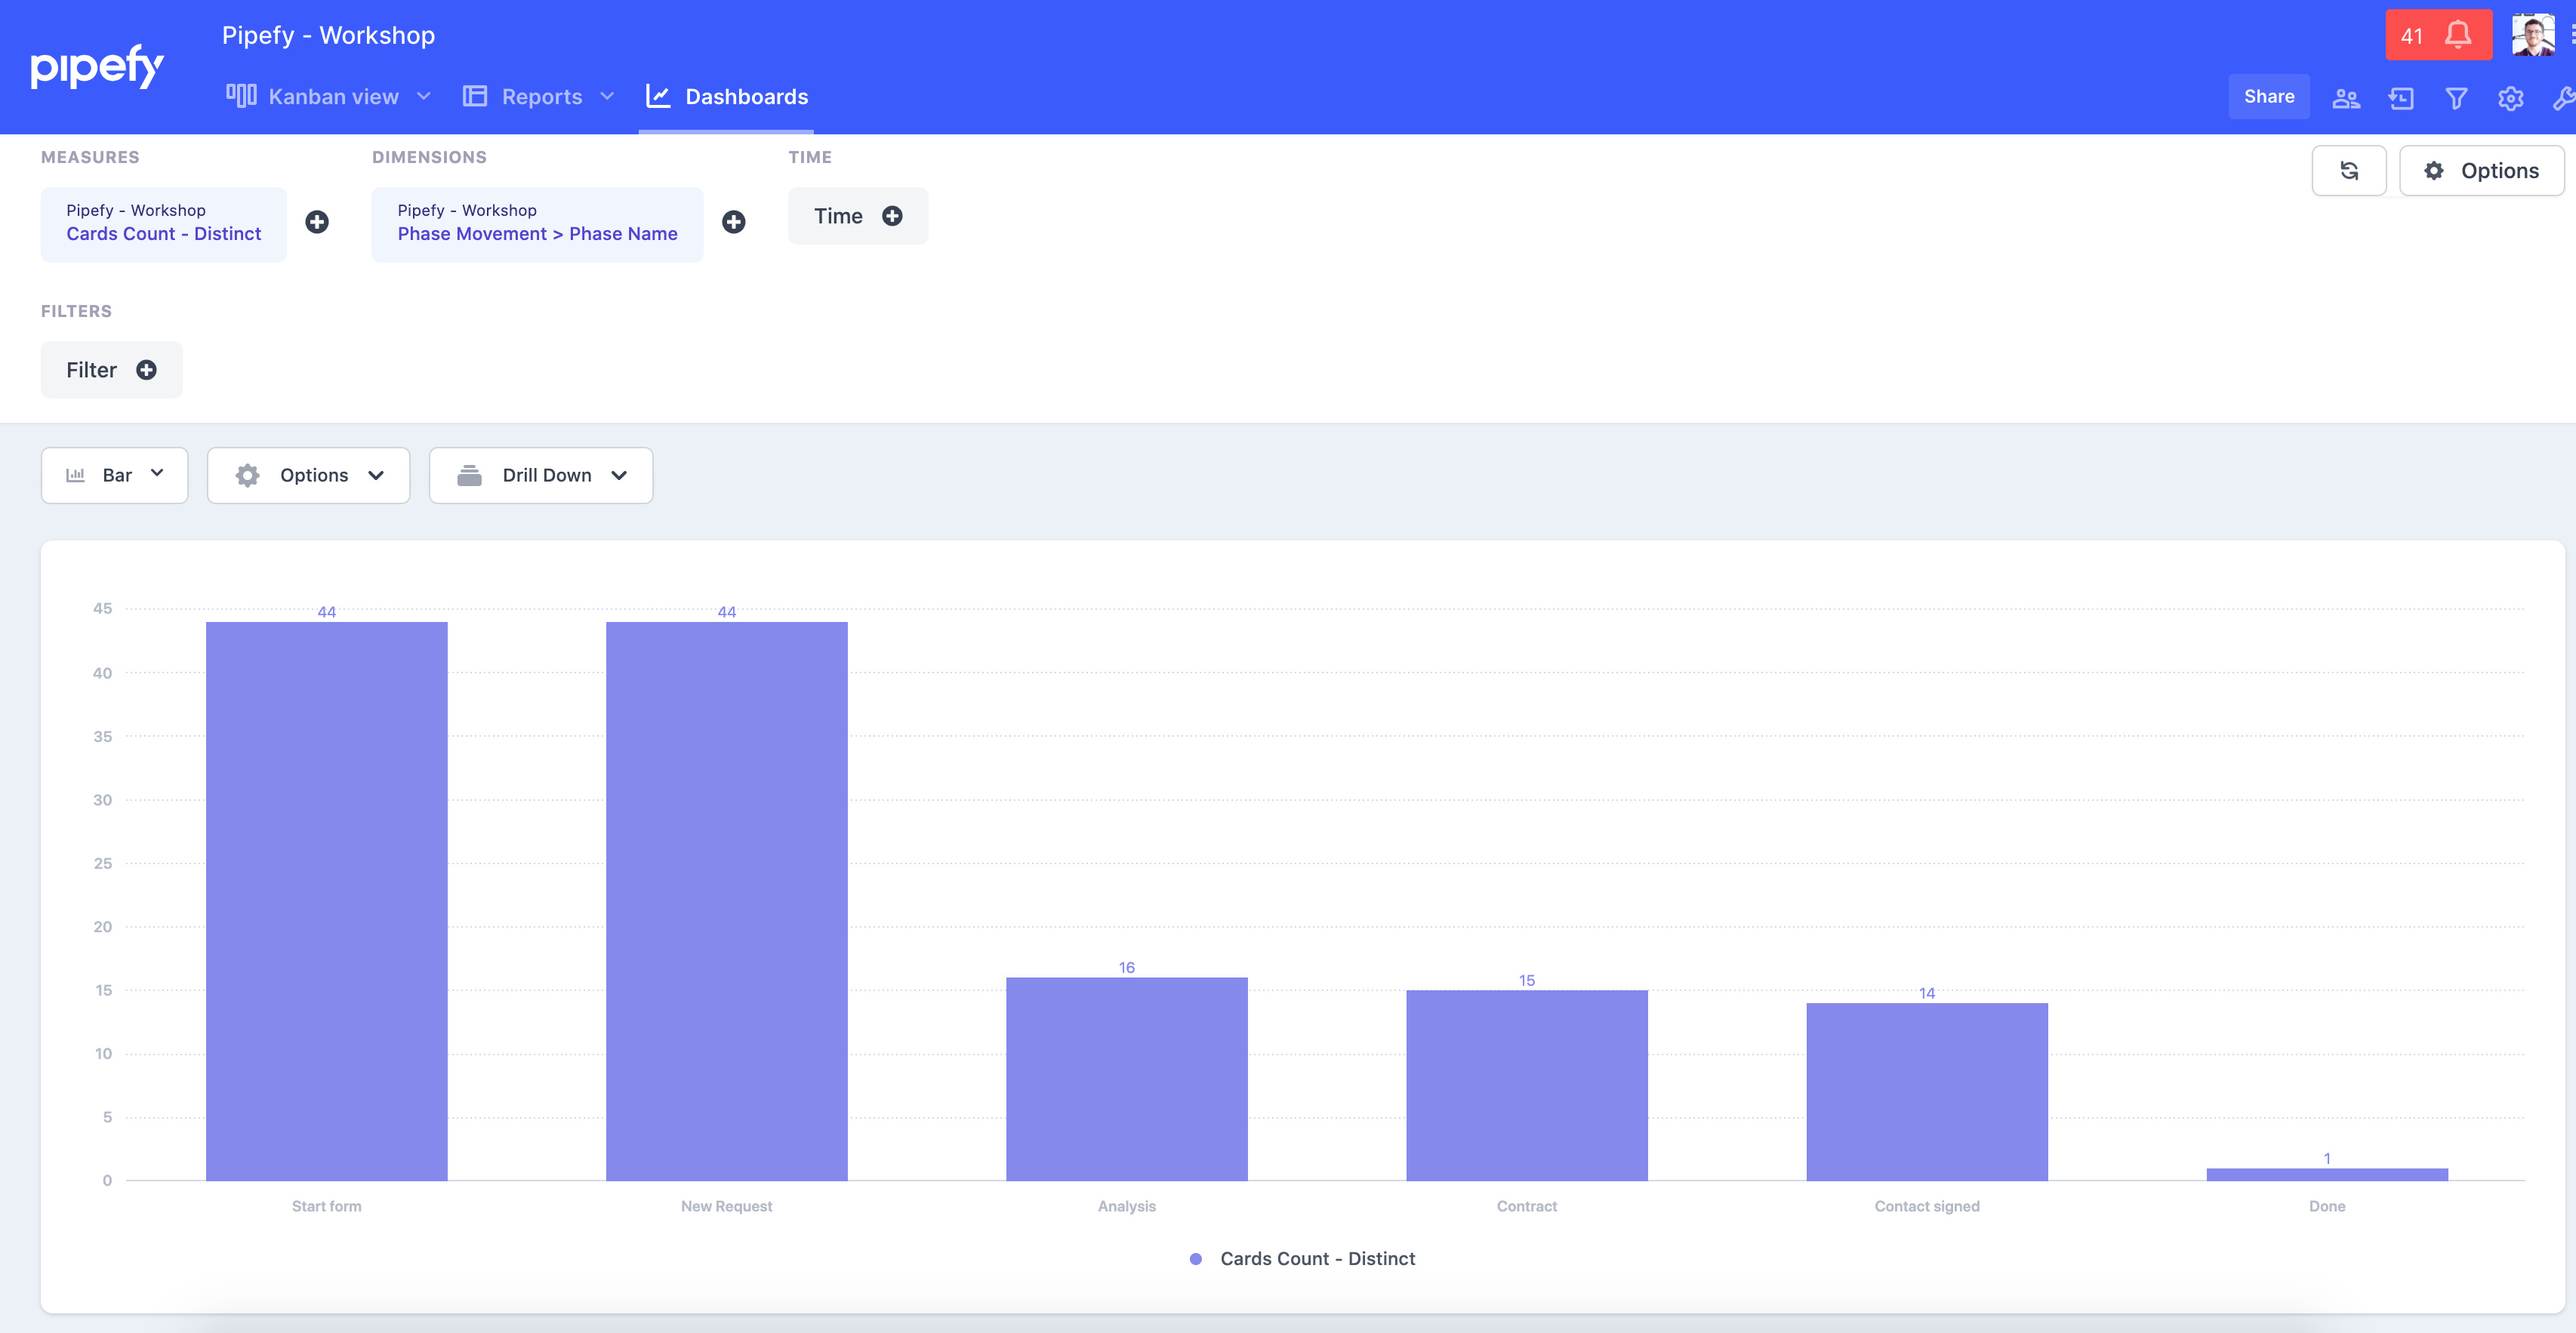
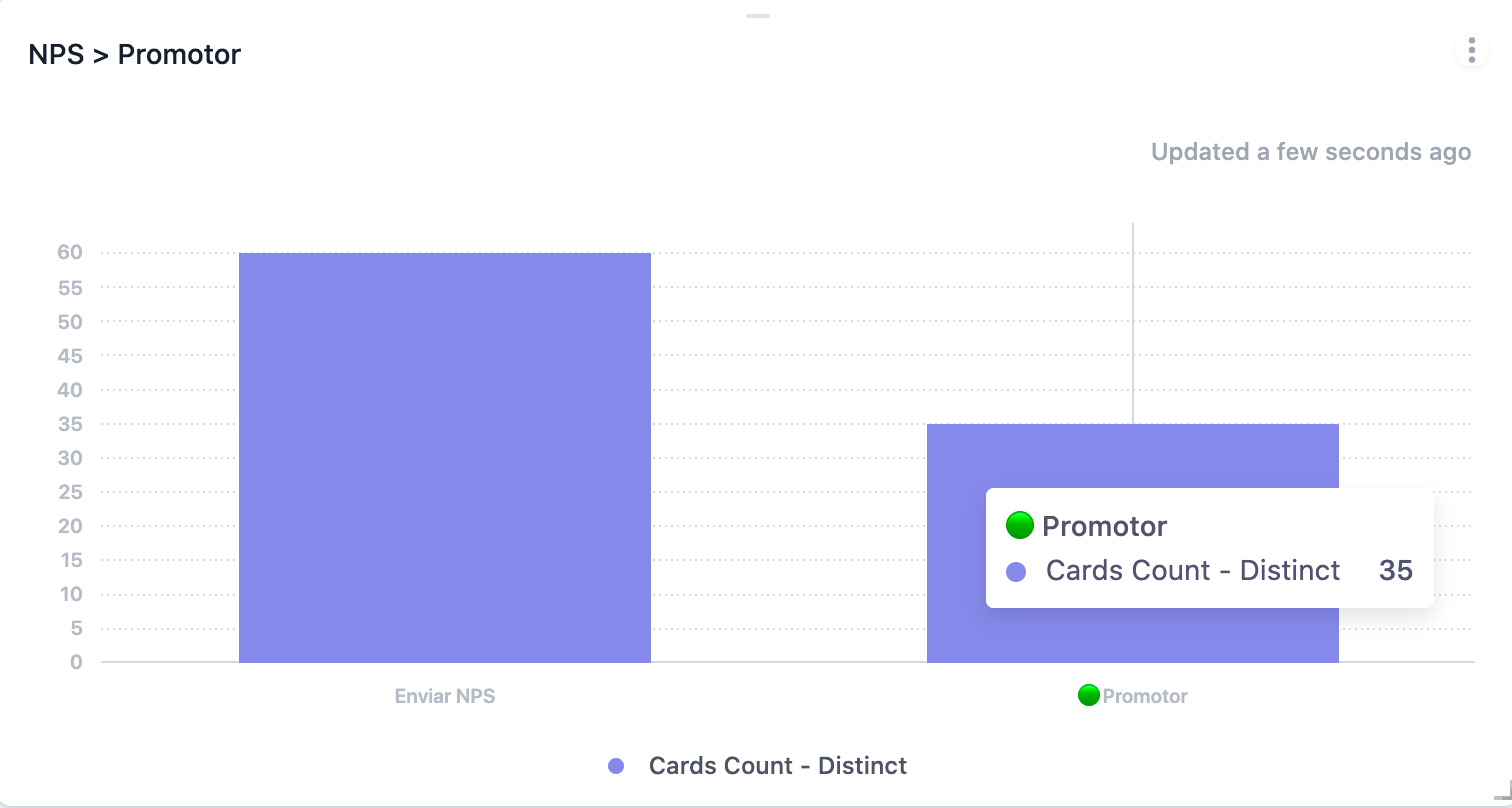
That is my "Conversion Funnel":
how many cards "opportunities" are in each phase:
"New requests"
Analysis
Contract
Contract signed
Done
that helps you?
If no, please let me know and i will try to help you :)
7 people like this

Reply
Rich Text Editor, editor1
Editor toolbars
Press ALT 0 for help
Join us in the Pipefy Community! 🚀
No account yet? Create an account
Login with your Pipefy credentials
or
Enter your E-mail address. We'll send you an e-mail with instructions to reset your password.