Question

Issue with grouping by month in dashboard chart

  • August 27, 2025
  • 1 reply
  • 68 views

michal-krzempek

Hi,
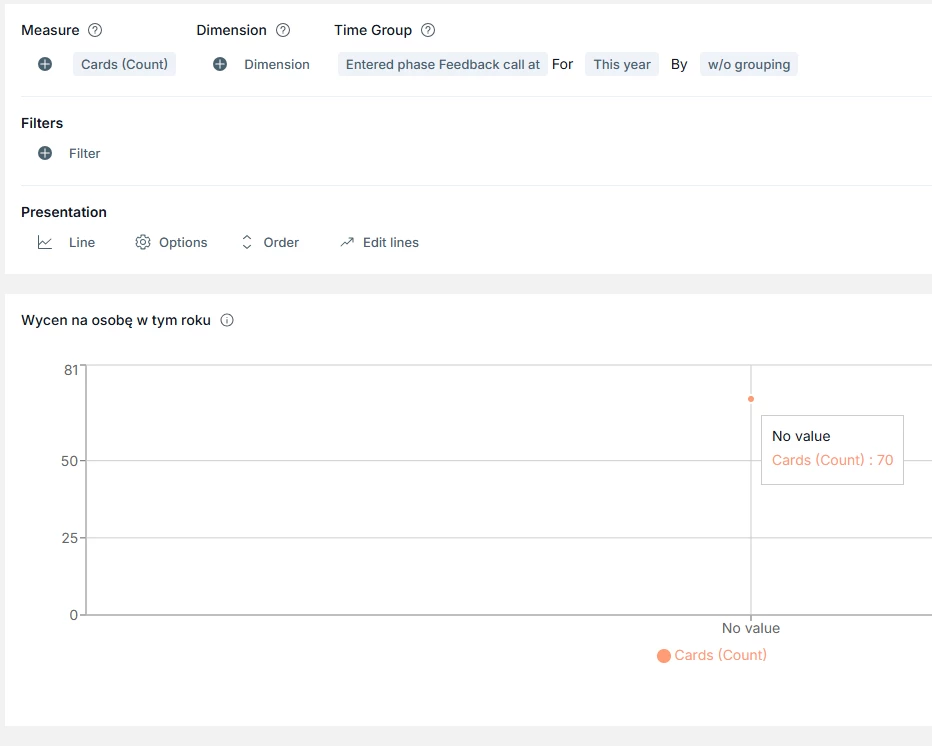
I’m having an issue with a dashboard chart in Pipefy. When I set up the chart to count cards that moved to the "feedback call" phase this year, it works correctly:


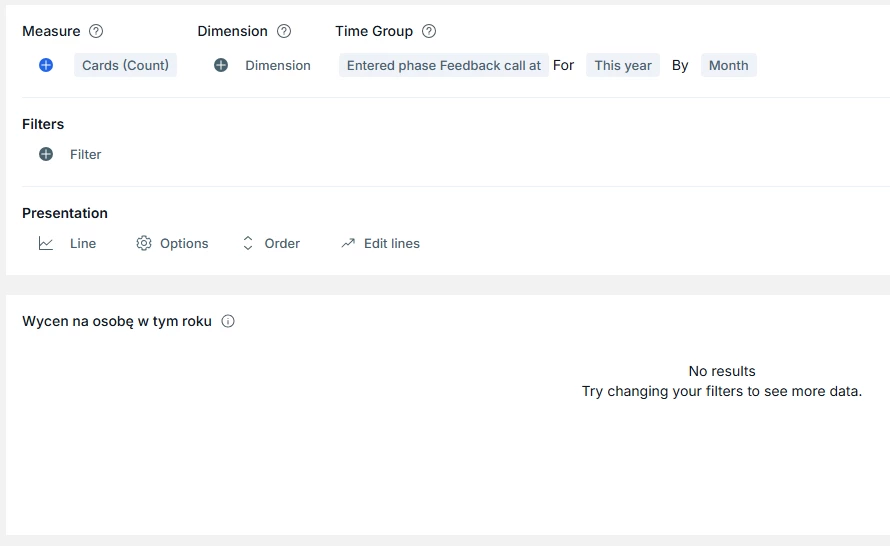
However, when I add grouping by months, the chart shows "no results".

Has anyone experienced a similar problem or knows how to fix this?


1 reply

Alan dOliveira
Pipefy Staff
Forum|alt.badge.img+1

Hello ​@michal-krzempek  

The issue still persist?
 

This usually happens when there is a mismatch between the filter and the grouping axis.

When you add the monthly grouping, make sure the X-axis is set to the exact same date field used in your filter (likely 'Date moved to phase: Feedback Call'). If the chart tries to group by 'Created at' or a custom date field that is empty for those specific cards, it will return 'no results'.

Try adjusting the 'Group by' settings to match the phase history date and see if that fixes it!